
You're posting great content, but you feel like you're just guessing. You're not sure which posts actually drive traffic, why your follower count stalled last month, or how to prove to your boss that social media is actually worth the investment. This isn't a strategy problem; it's a data problem.
This guide cuts through the noise. We're not going to talk about abstract theories. We'll give you practical, step-by-step instructions for using social media analytics and reporting to solve real problems, make smarter decisions, and prove your impact.
What's the Difference Between Analytics and Reporting? (And Why You Need Both)
It's easy to use these terms interchangeably, but they solve two very different problems. Getting this right is the first step to stopping the guesswork.
Social Media Analytics is your real-time diagnostic tool. Think of it as the dashboard in your car. It shows you live data: your speed (engagement rate), your fuel level (audience growth), and the engine temperature (brand sentiment). Analytics answers immediate questions like:
- "Did our latest Instagram Reel perform better than last week's?"
- "What time of day are our TikTok followers most active?"
- "Which posts are driving the most clicks to our website right now?"
Without analytics, you’re driving blind, hoping you don't run out of gas.
Social Media Reporting is your strategic roadmap. This is the postcard you send home from your trip. It takes all the raw data from your dashboard, organizes it, and tells a clear story. Reporting answers the bigger, strategic questions:
- "What was the overall ROI of our Q2 social media campaigns?"
- "How has our audience sentiment changed over the last six months?"
- "Based on the data, what should our content strategy be for the next quarter?"
Analytics gives you the data. Reporting turns that data into an action plan.
The Problem with Vanity Metrics
One of the biggest traps in social media is chasing vanity metrics. These are numbers that look impressive on the surface but don't actually tell you anything about your business's health.
Common Causes:
- Follower Count: A large follower number means nothing if those followers don't engage, click, or buy. A brand with 1,000 engaged fans who convert is far more valuable than a brand with 10,000 passive followers.
- Total Likes: Likes are a weak form of engagement. They require minimal effort and don't indicate if the user actually absorbed your message or felt compelled to act.
Actionable Fix: Focus on Metrics That Show Real Intent
To get a true read on your performance, you need to track metrics that signal genuine connection and business impact.
- Prioritize Engagement Rate: This measures the percentage of your audience that actively interacts (comments, shares, saves) with your content. It’s a direct indicator that your message is resonating.
- Track Conversions: This is where social media proves its value. Track link clicks, newsletter sign-ups, and product purchases that originate from social. This connects your efforts directly to the bottom line.
- Monitor Brand Sentiment: Go beyond numbers and analyze the feeling behind brand mentions. Are people talking about you positively or negatively? This is a crucial gut-check for your brand reputation.
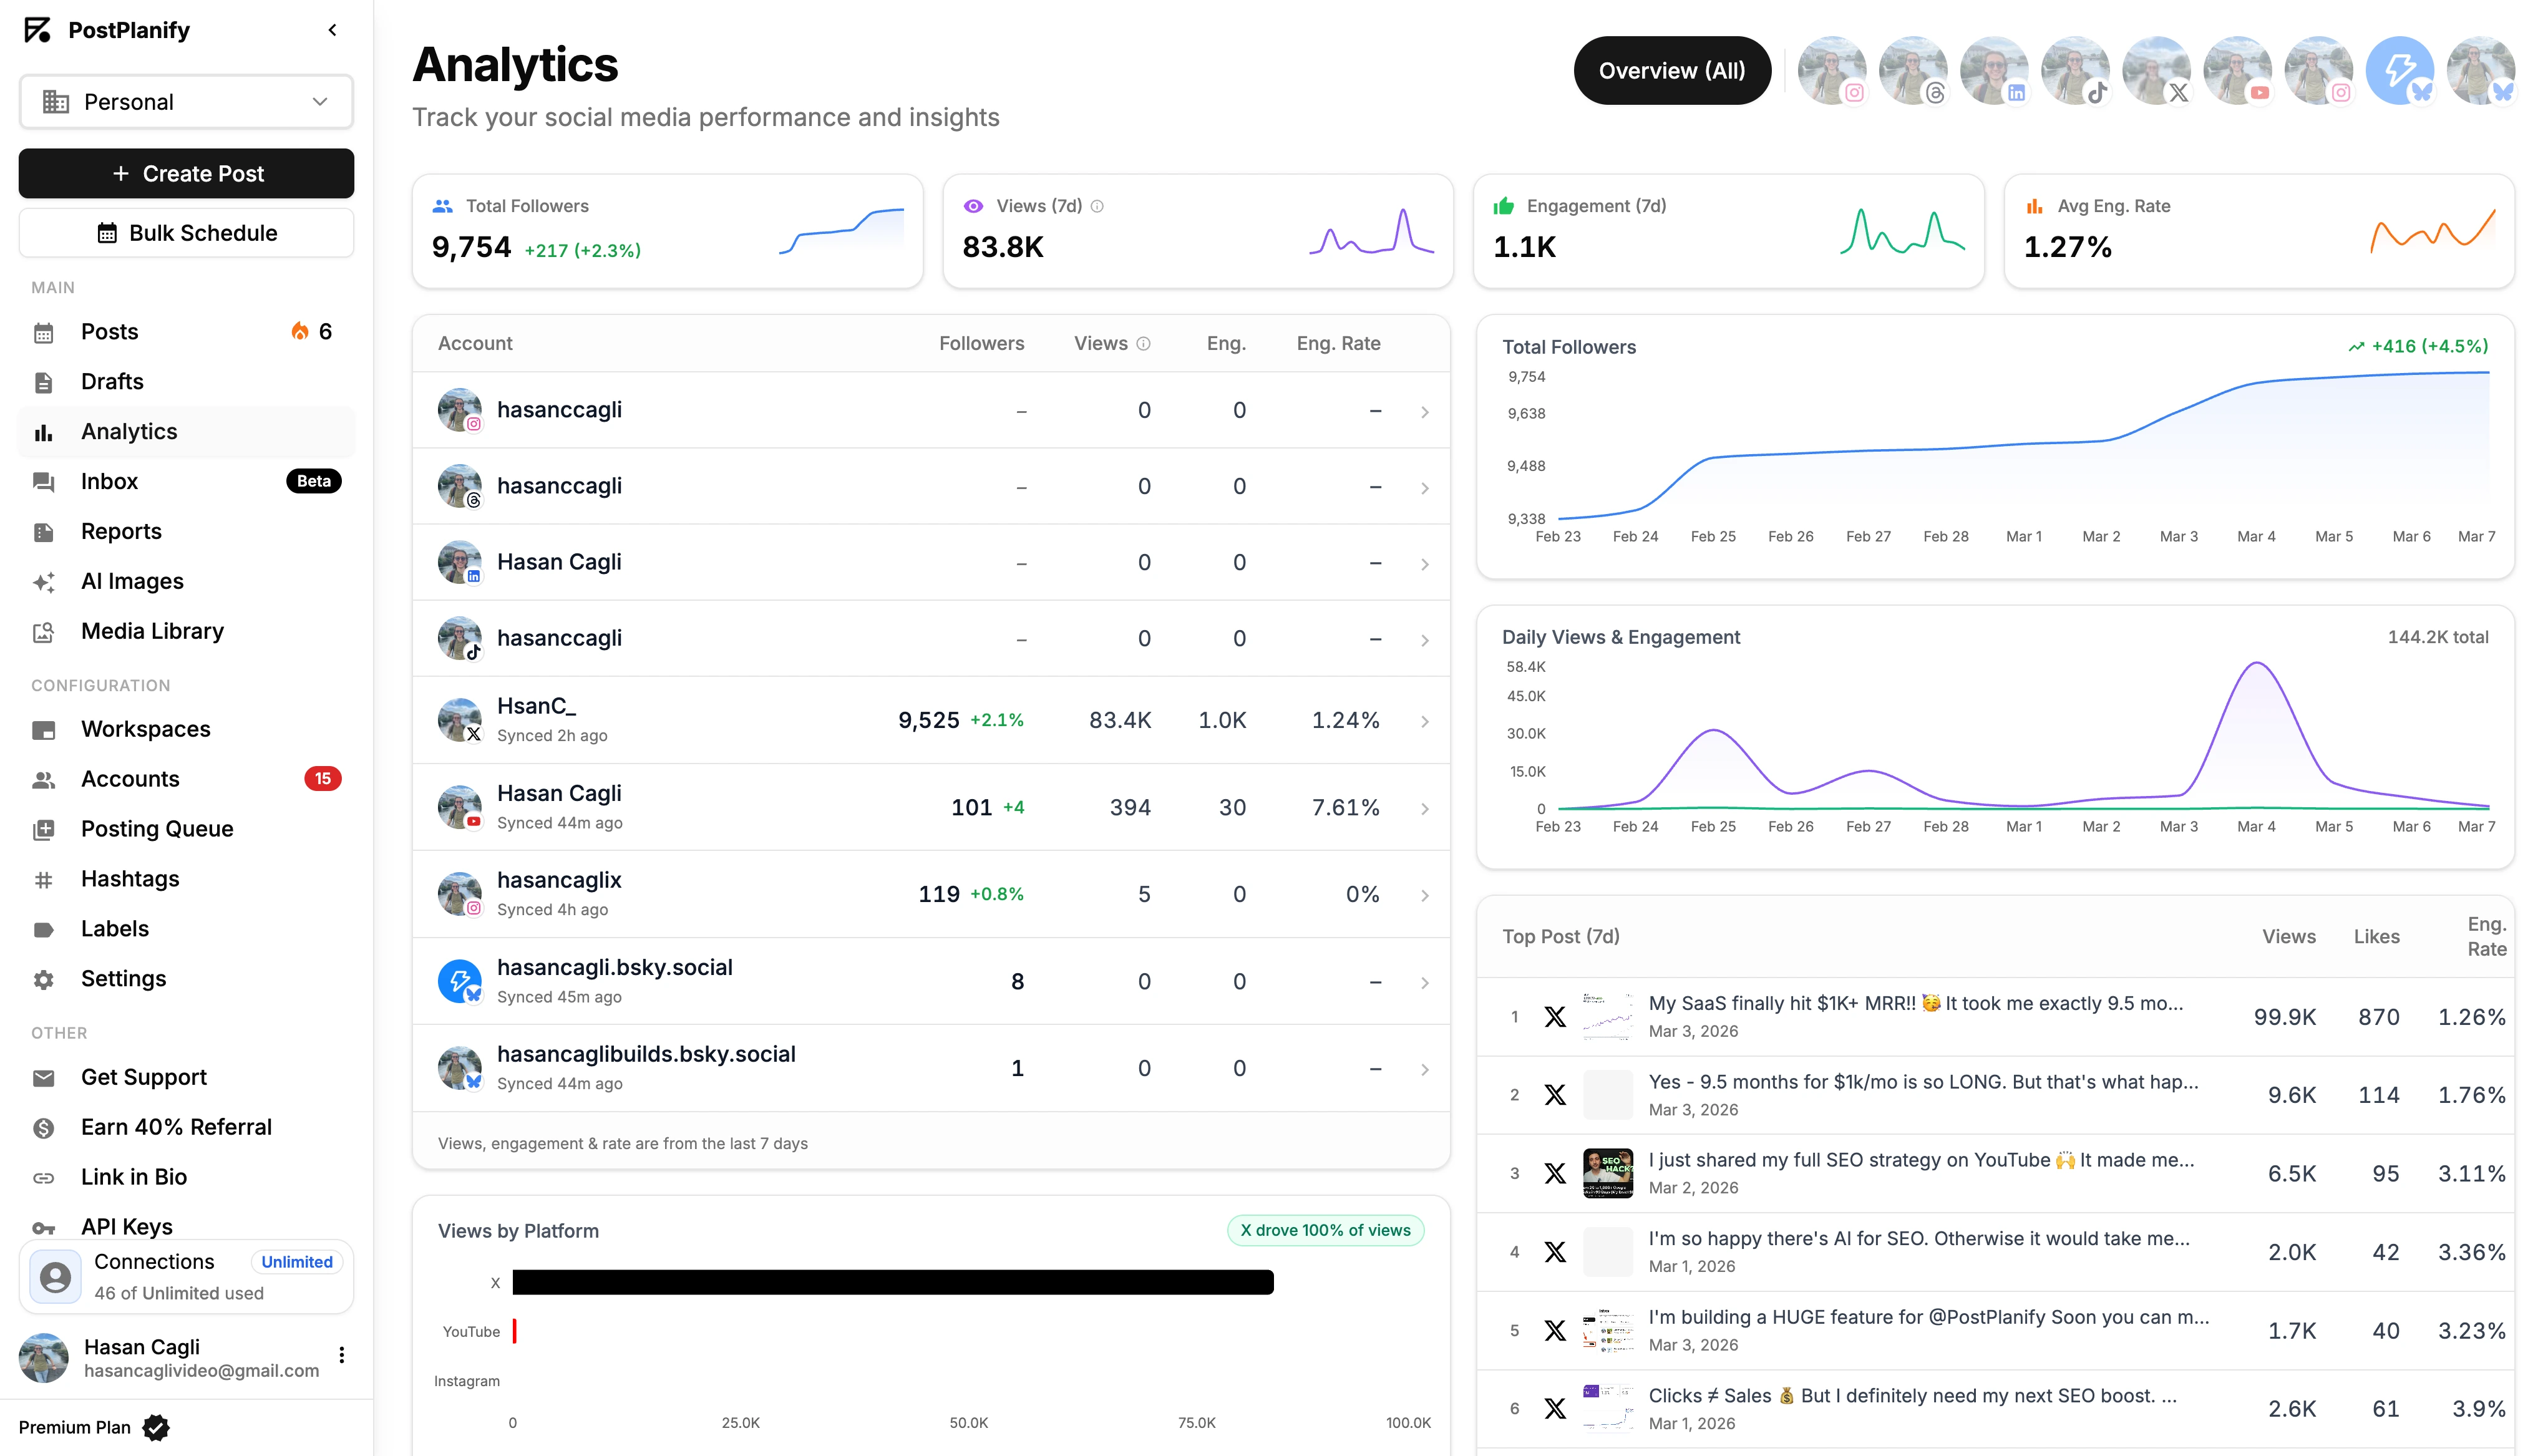
All your social media in one simple dashboard
Schedule posts, track analytics, and reply to comments/DMs — without switching tabs.

Engagement
+18%
Views
52.8k
Why This Matters More Than Ever
The demand for solid social media analytics and reporting is exploding. Businesses are realizing that the basic, built-in metrics on each platform just don't cut it. The global market for social analytics tools is projected to rocket past $43 billion by 2030, fueled by the rise of social commerce and data from over 5.24 billion social media users. Find out more about the explosive growth of the social analytics market.
This isn't just a trend; it’s a fundamental shift. Companies are moving away from just being on social media to strategically measuring its real-world impact.
This is where a tool like PostPlanify becomes essential. It consolidates analytics from all your platforms into one clear dashboard, saving you from juggling five different tabs. This makes it easier to connect your content strategy directly to real business goals.
Focusing on Metrics That Actually Drive Business Growth
You can drown in social media data and still have no clue what it means for your business. The secret isn't to track everything; it's to track the right things. That means focusing on metrics that tie directly to your business goals.
To make this practical, let's group the most important metrics into four pillars. These pillars follow the natural journey a customer takes with your brand—from first hearing about you to becoming a loyal advocate.
As you can see, analytics are just the foundation. Without clear reporting to turn that data into a coherent story, you'll never hit those big-picture business goals.
Pillar 1: Awareness Metrics
Problem: "I'm not sure if we're reaching new people or just talking to the same followers over and over."
Awareness metrics tell you how many people are seeing your content and how far your message is spreading. This is the top of your funnel.
- Reach: The total number of unique people who see your content. If 500 individual accounts saw your post, your reach is 500.
- Impressions: The total number of times your content was displayed. One person could see your post three times, counting as 1 in reach but 3 in impressions.
High reach and impressions mean the platform's algorithm is showing your content to new audiences, which is the first step to growth. For a deep dive into how each platform counts impressions differently, see our social media impressions guide.
Pillar 2: Engagement Metrics
Problem: "People see our posts, but nobody is interacting. Is our content boring?"
Engagement metrics tell you if people care about what you're posting. High engagement is a powerful signal to algorithms that your content is valuable, earning you more reach.
- Likes, Comments, Shares, and Saves: These are the core interactions.
- Platform-Specific Nuances: A Share on LinkedIn carries more weight than a 'Like' because it's a professional endorsement. On Instagram, a Save signals that a user found your content so useful they wanted to bookmark it. On X (formerly Twitter), a Retweet or Quote Tweet is how you reach entirely new audiences.
If you're struggling to boost these numbers, our guide on how to grow Instagram followers organically is packed with actionable strategies.
Pillar 3: Conversion Metrics
Problem: "We get a lot of likes, but I can't prove that social media is driving any actual leads or sales."
This is where you connect social media to business results. Conversion metrics track whether your audience is taking the actions you want them to take.
- Click-Through Rate (CTR): The percentage of people who saw your post and clicked the link. This directly measures how compelling your call-to-action is.
- Conversion Rate: The percentage of users who clicked a link and then completed a goal on your website (e.g., filled out a form, made a purchase).
- Cost Per Click (CPC): For paid ads, this shows how much you're paying for a single click. A lower CPC means your ad creative and targeting are efficient.
Ultimately, social media analytics must show a real business impact. This means connecting your activities to revenue by calculating marketing ROI.
Pillar 4: Loyalty and Advocacy Metrics
Problem: "I know we have some happy customers, but are we building a real community that will recommend us?"
These metrics measure long-term brand health and help you understand if you're turning casual followers into passionate advocates.
- Brand Mentions: How often is your brand discussed on social media, even when you aren't tagged directly?
- Sentiment: What's the emotion behind those mentions? Are people speaking positively, negatively, or neutrally about you? This provides critical context that raw numbers miss.
Tracking these nuanced metrics used to be a huge headache, but technology has caught up. AI can now process unstructured content like comments in real-time. This has led to a 35% surge in tracking engagement from influencers and user-generated content as businesses recognize their commercial value.
Tools like PostPlanify now build these AI-powered features right in, making sophisticated social media analytics and reporting accessible to everyone.
Mapping Social Media Metrics To Business Goals
This table provides a practical cheat sheet. Start with your goal, then identify the right KPIs to track.
| Business Goal | Primary Metrics to Track | What These Metrics Tell You |
|---|---|---|
| Increase Brand Awareness | Reach, Impressions, Audience Growth Rate | How many new people are discovering your brand and how quickly your audience is expanding. |
| Drive Website Traffic | Click-Through Rate (CTR), Clicks, Cost Per Click (CPC) | Whether your social content is successfully compelling users to visit your website or landing pages. |
| Generate New Leads | Conversion Rate, Form Fills, Newsletter Sign-ups | How effectively your social media efforts are turning followers into potential customers. |
| Improve Customer Loyalty | Brand Mentions, Sentiment Analysis, Customer Reviews | How your audience feels about your brand and whether they are becoming vocal advocates. |
| Boost Community Engagement | Likes, Comments, Shares, Saves | If your content is resonating with your audience and sparking meaningful conversations. |
| Increase Sales & Revenue | Social Media ROI, Sales from Social Referrals | The direct financial impact of your social media activities on your company's bottom line. |
Navigating Analytics on Key Social Media Platforms
Every social platform has its own native analytics tool, and they all speak a different data language. It’s confusing and makes it nearly impossible to get a clear, comparative view of your performance.
This section is your practical field guide. We'll show you exactly where to find—and how to interpret—the metrics that matter on Instagram, TikTok, Facebook, X, and LinkedIn.
Instagram Insights: A Step-by-Step Guide
Problem: "I can't see any analytics on my Instagram account."
Cause: You're likely using a Personal Account. Instagram Insights is only available for Professional Accounts (Business or Creator).
Actionable Fix:
- Go to your Instagram profile.
- Tap "Edit Profile."
- Tap "Switch to Professional Account" and follow the prompts. The switch is free and unlocks your data instantly.
Once you have a Professional Account, tap the "Professional dashboard" on your profile, then go to "Account insights."
Here’s what to look for:
- Accounts Reached: Check the follower vs. non-follower breakdown. A high number of non-followers is a clear sign your content is hitting the Explore page or being shared effectively.
- Accounts Engaged: This is a better measure of resonance than just likes. It counts the unique accounts that interacted with your content, giving you a truer picture of who is paying attention.
- Profile Activity: Look for high-intent actions like "Profile visits," "Website taps," and "Email button taps." These are your warmest leads from the platform.
Limitation: Instagram's native analytics only show data for the last 90 days. This makes long-term trend analysis impossible without a third-party tool. You also cannot export the data.
Decoding TikTok Analytics
Problem: "My TikTok views are all over the place. I don't know what's working."
Cause: TikTok's algorithm is driven by watch time and traffic source. If you're not tracking these, you're missing the key signals.
Actionable Fix:
- Ensure you have a Business or Creator account.
- Tap the three lines in the top-right of your profile, then go to "Creator tools," and tap "Analytics."
Focus on these key metrics:
- Traffic Source Types: This is critical. It shows how people found your video. A high percentage from the "For You" page means the algorithm is pushing your content to new audiences.
- Average Watch Time: This is arguably the most important metric on TikTok. A long average watch time signals to the algorithm that your content is engaging, which dramatically increases its odds of going viral.
- Follower Activity: Use this tab to find the exact hours and days your followers are most active. Schedule your posts for these peak times to get strong initial engagement, which helps trigger the algorithm. Use a TikTok engagement calculator to benchmark your performance.
Facebook and Meta Business Suite
Problem: "The Meta Business Suite is overwhelming. Where should I even start?"
Cause: The interface combines data for Facebook and Instagram, and it's built for both organic and paid activity, which can be confusing.
Actionable Fix:
- Navigate to the Meta Business Suite and click on "Insights."
- Focus on these specific areas to avoid getting lost:
- Content Performance: Look at Reach, Link Clicks, Comments, and Shares for individual posts. Sort by your top-performing content to identify patterns. What do your most-shared posts have in common?
- Audience Demographics: Check the age, gender, and location data of your followers. If this doesn't align with your ideal customer profile, your content strategy may be attracting the wrong audience.
- Benchmarking: Use this feature to add competitor pages. Track their page growth and engagement rates to see how you stack up in your industry.
If you’re running paid campaigns, you must learn to navigate the more detailed reports in mastering Facebook Ads Manager.
X Analytics and LinkedIn Analytics
While often grouped together, X (formerly Twitter) and LinkedIn serve different goals and require focusing on different metrics.
On X, your main problem is cutting through the noise. Focus on:
- Engagement Rate: This is the most important metric. It's calculated as (Engagements / Impressions). A high rate means your tweet was compelling enough to stop the scroll.
On LinkedIn, your goal is professional authority and lead generation. Prioritize:
- Visitor Demographics: This is a goldmine for B2B. You can see the job function, seniority, and industry of people visiting your page.
- Update CTR: Impressions show who saw your post; CTR shows who was compelled to act. This is a direct measure of your content's effectiveness in a professional context.
The biggest challenge with all native tools is the lack of a unified view. Constantly switching between platforms makes it impossible to see the big picture. This is why a centralized dashboard like PostPlanify is so valuable—it pulls all your data into one clean interface so you can compare performance without the manual work.
Building Your First Social Media Dashboard
A dashboard turns messy data into a clear story you can understand at a glance. It's the tool that guides your strategy and stops you from getting lost in spreadsheets.
Problem: "I built a dashboard, but no one on my team uses it."
Cause: The dashboard was likely built without a clear purpose or audience in mind. It's either showing the wrong metrics or is too cluttered to be useful.

Step 1: Define the Audience and Purpose
Before you build anything, answer two questions: Who is this for? And what decision will they make with it?
- For the CEO/Leadership: They need the 30,000-foot view. Focus on high-level business metrics like ROI, leads from social, and brand sentiment. Keep it clean and simple.
- For the Content Team: They need tactical details. Focus on post-level performance, engagement rates by content format, and audience growth. This dashboard should help them decide what to create next week.
Step 2: Choose 8-10 Key KPIs
A cluttered dashboard is an ignored dashboard. Don't try to track everything. Based on your audience and purpose, select only the Key Performance Indicators (KPIs) that matter most.
Example for a Brand Awareness Dashboard:
- Total Reach (by platform)
- Total Impressions (by platform)
- Audience Growth Rate
- Brand Mentions & Sentiment
Example for a Lead Generation Dashboard:
- Website Clicks
- Click-Through Rate (CTR)
- Conversion Rate from Social
- Cost Per Lead (CPL)
Step 3: Choose Your Tool and Build It
You can use a spreadsheet, but it's a manual, error-prone process. A dedicated tool is a much smarter approach.
A platform like PostPlanify includes a built-in analytics dashboard that automatically pulls and visualizes data from your connected accounts. This saves hours of manual work and ensures your data is always up-to-date. You can also establish a performance baseline in seconds using our Instagram engagement calculator.
Essential Components for Any Dashboard:
- Performance Overview: A high-level snapshot for a quick health check.
- Audience Demographics: Who are you talking to?
- Platform-Specific Drill-Down: Deep-dive into each channel.
- Content Performance: What are your best-performing posts and formats?
- Goal Tracking: Measure progress against your specific business objectives.
Organize your dashboard logically, either by platform or by business goal. Use clear headings and visuals like line graphs for trends and bar charts for comparisons to make insights easy to spot.
How to Create Reports That Drive Action
A dashboard is for monitoring; a report is for decision-making. A great report doesn't just present data; it interprets it, adds context, and provides a clear recommendation for what to do next.
Problem: "I send out reports, but nothing ever changes. They just get filed away."
Cause: Your report is likely a data dump, not a strategic document. It's not tailored to the audience and doesn't offer clear, actionable recommendations.
Tailor the Narrative to Your Audience
A one-size-fits-all report will fail.
- For the CEO: Focus on the bottom line. How did social media contribute to revenue, leads, or brand health? Frame everything in terms of ROI.
- For the Content Team: Focus on tactical insights. What specific content formats are working? What topics are resonating? Which posts fell flat, and why?
A Proven 5-Part Report Template
Structure your report like a story to guide your audience to the right conclusions.
- Executive Summary: Start with the punchline. In one paragraph, state the key win, the main challenge, and your top recommendation. Assume this is the only part a busy executive will read.
- Key Wins and Highlights: Lead with successes. Celebrate what went right to build momentum before diving into the details.
- Performance Against Goals: Use simple visuals to show progress toward your objectives. A line graph showing target vs. actual growth is instantly understandable.
- Deep-Dive Analysis (The "Why"): This is the heart of your report. Don’t just state that video performed well. Explain why. For example: "Our short-form tutorial Reels drove 50% more saves than static images because they provided immediate, actionable value."
- Actionable Recommendations: End with a clear path forward. Your recommendations must be specific, measurable, and directly tied to the insights you just presented.
Phrasing Insights for Maximum Impact
Your language matters. Be a confident expert, not a passive observer.
Instead of this: "It seems like posts at 9 AM might be getting more likes." Try this: "Our data shows that posts published between 8 AM and 10 AM receive 25% higher engagement on average. We recommend shifting our primary posting window to capitalize on this peak activity."
The second version is confident, specific, and provides a clear action. By delivering reports that are clear, confident, and focused on next steps, you become a trusted strategic advisor.
Troubleshooting Common Analytics Problems
Even with the best tools, social media analytics can be messy. Here are practical fixes for the most common headaches.
Problem 1: My Data is Inconsistent or Delayed
Symptoms: You pull a report on Monday, and the numbers have changed by Tuesday. Engagement metrics in your third-party tool don't match the native platform analytics.
Causes: API delays, temporary platform bugs, or data processing lag.
Actionable Fixes:
- Implement a 48-Hour Rule: Never report on data that’s less than 48-72 hours old. This gives platform APIs time to sync and stabilize.
- Cross-Reference Your Sources: If a number looks off, quickly check it against the native analytics (e.g., Instagram Insights). A big discrepancy is a red flag.
- Use a Reliable Aggregator: A tool like PostPlanify connects directly to official platform APIs and has systems built to handle data syncing properly, providing a single, stable source of truth.
Problem 2: I Can't Prove ROI (The Attribution Nightmare)
Symptom: You know a social campaign drove interest, but you can't prove it led to sales because the customer journey was complex (e.g., they saw a post, then searched on Google a week later).
Cause: Standard "last-click" attribution models often fail to give social media credit for its role early in the customer journey.
Actionable Fixes:
- Master UTM Parameters: UTMs are small bits of code you add to the end of a URL. They are non-negotiable. Use them on every single link you share on social media to tell your analytics tools exactly where your traffic came from.
- Create Dedicated Landing Pages: For major campaigns, build a unique landing page that is only promoted on social channels. This provides undeniable proof that every conversion from that page originated from your social efforts.
- Focus on Assisted Conversions: In Google Analytics, look at the full customer journey. This allows you to show stakeholders how social media assists in sales, even when it wasn't the final click.
- Frame Engagement as a Long-Term Win: Not every post is about an immediate sale. The goal is often to build a community and stay top-of-mind. Our guide on how to improve social media engagement provides the language to frame these "soft" metrics as crucial long-term investments.
Got Questions About Analytics and Reporting? We’ve Got Answers.
Jumping into social media analytics can feel overwhelming. Here are straight-up answers to the most common questions.
How Often Should I Actually Be Reporting on This Stuff?
The right reporting schedule depends on who is reading it and what they need to do with it.
- Weekly: For the social media team. This is a tactical check-in to adjust the content plan for the week ahead.
- Monthly: For marketing managers. This report tracks progress against goals and informs the strategy for the next month.
- Quarterly: For leadership. This report connects social media activity directly to business impact—ROI, leads, and brand health.
How Do I Prove Social Media is Actually Worth the Money (aka Measure ROI)?
The key is to track both direct and "assisted" conversions. The single most powerful tool for this is using UTM parameters on every single link you share. This puts a tracking tag on your traffic so your website analytics knows exactly where it came from. For big campaigns, create a dedicated landing page used only for social media to get undeniable proof of your impact.
Should I Just Use the Free Platform Analytics or Pay for a Tool?
Both have their place.
-
Platform Analytics (like Instagram Insights): Great for quick, on-the-fly checks on recent post performance. However, they have major limitations, like only showing data for the last 90 days and making it impossible to compare performance across platforms.
-
Third-Party Tools: A dedicated tool like PostPlanify solves these problems. It pulls all your data from every channel into one dashboard, allowing you to track long-term trends and directly compare what’s working on TikTok vs. X without the manual work of patching together reports. For a side-by-side comparison of 11 options, see our roundup of the best social media analytics tools.
Your Social Media Analytics Checklist:
- Define Your Goal: What business problem are you trying to solve?
- Select Relevant KPIs: Choose metrics that directly map to your goal.
- Choose Your Tool: Use native analytics for quick checks and a unified tool like PostPlanify for deep analysis and reporting.
- Build a Focused Dashboard: Tailor it to a specific audience (leadership vs. content team).
- Schedule Your Reporting Cadence: Set up weekly, monthly, and quarterly reports.
- Analyze the "Why": Don't just present data; interpret it and explain what it means.
- Provide Actionable Recommendations: End every report with clear next steps.
All your social media in one simple dashboard
Schedule posts, track analytics, and reply to comments/DMs — without switching tabs.
Engagement
+18%
Views
52.8k
About the Author

Hasan Cagli
Founder of PostPlanify, a content and social media scheduling platform. He focuses on building systems that help businesses, agencies, and teams plan, publish, and manage content and social media more efficiently across platforms.


