
Social media impressions are the total number of times your content is displayed on a screen. If you're trying to figure out why some posts take off while others disappear, understanding this metric is your first step. It's the most fundamental measure of your content's visibility.
Think of it this way: your post is a digital ad on a webpage. Every time that page loads and your ad is shown, that's one impression. It doesn't matter if the same person sees it five times—each view counts as a new impression. This number tells you if the platform's algorithm is even putting your content in front of people.
Why Impressions Aren't Showing the Full Picture (and What Is)
A social media impression is a raw count of views. It tracks every single time your post, story, or video appears in someone’s feed. The critical detail is that impressions count views, not viewers.
This is a common point of confusion. A single person can generate multiple impressions for the same piece of content. If someone sees your post in their feed, scrolls past, and then sees it again later when a friend shares it, that counts as two impressions from one unique user.
A solid grasp of What Are Impressions is essential for anyone trying to make sense of their social media analytics. It’s the first signal that the algorithm is working to get your content seen.
The Problem: Confusing Impressions with Reach
Many people get stuck here. Impressions and reach sound similar, but they measure two completely different things. Getting this wrong leads to misinterpreting your data and making poor strategy decisions.
- Impressions: The total number of times your content was displayed. This is a measure of frequency and overall exposure.
- Reach: The total number of unique people who saw your content. This is the actual size of your audience for a specific post.
Here’s a practical scenario: Your latest post has 1,000 impressions and a reach of 500. This means 500 individual people saw your content, and on average, they saw it twice. A high impression count with a relatively low reach isn't a problem—it often means a specific group finds your content so valuable that the algorithm keeps showing it to them.
Why Impressions Are a Critical First Step
Impressions are the foundation of brand awareness. Before someone can like, comment, share, or click, they have to see your content first. This initial visibility is precisely what impressions measure, making them a top-of-funnel metric that precedes every other interaction.
High impression counts tell you that the platform's algorithm sees your content as valuable and is actively showing it to users.
By monitoring your impressions, you can answer critical questions:
- Is my content visible? Are my posts actually making it into people's feeds?
- Does the algorithm favor my content? Is the platform actively pushing my posts to users?
- Are my ad campaigns delivering? Are my paid ads being served to my target audience as intended?
- Is my content resonating? A high impression-to-reach ratio often means your content is "sticky" enough to be shown to the same users multiple times.
Impressions provide the first piece of feedback on your content's performance. From there, you can analyze reach, engagement, and conversions to understand the full impact. Tools like PostPlanify help by consolidating these analytics, allowing you to see how your scheduled content performs without juggling multiple platforms.
Impressions vs. Reach vs. Engagement: What Actually Matters
If you want to make smart decisions about your social media strategy, you have to understand these three core metrics. They are often used interchangeably, but they each tell a distinct—and equally important—part of your content's story.
Let's use a real-world analogy. Imagine your social media post is a flyer for a local event.
- Impressions: This is the total number of flyers you handed out. If you gave the same person three flyers throughout the day, that’s three impressions. It’s a raw count of how many times the flyer was seen.
- Reach: This is the number of unique, individual people who received a flyer. Even if you handed out 500 flyers, if only 100 different people took one, your reach is 100.
- Engagement: This is the number of people who took action after getting the flyer. They visited the website, bought a ticket, or showed up at the event. This measures genuine interest.
This distinction is crucial. Social media impressions measure how often your content is being shown, reach measures your unique audience size, and engagement measures how much that audience cares. You need all three for a complete picture.
What This Looks Like in Your Analytics
Theory is one thing, but what do these numbers mean when you're looking at your dashboard? The relationship between these metrics reveals actionable insights.
Here are common scenarios and what they tell you:
- High Impressions, Low Reach: This typically means a small, dedicated group of your followers is seeing your content repeatedly. The algorithm has identified that this post resonates with them and is serving it to them multiple times. This indicates strong content "stickiness" with your core audience.
- High Reach, Low Engagement: Your content is getting in front of many new people, but it isn't compelling enough to make them stop scrolling and interact. Your visuals might be catching their eye, but the caption or call to action isn't strong enough. If this is happening, our guide on how to improve social media engagement provides practical fixes.
- High Impressions and High Reach: This is the ideal scenario for growth. Your content is resonating with your current followers (leading to multiple views) and is being pushed out to new audiences on explore pages, through hashtags, or via shares.
Impressions vs. Reach vs. Engagement: A Quick Comparison
This table breaks down the unique role each metric plays so you can quickly interpret your data.
| Metric | What It Measures | Example Scenario | What It Tells You |
|---|---|---|---|
| Impressions | The total number of times your content was displayed on a screen. | Your post was shown 5,000 times, including multiple times to some users. | How frequently the algorithm is serving your content (Visibility). |
| Reach | The number of unique accounts that saw your content at least once. | Your post was seen by 3,000 individual people. | The actual size of the audience you connected with (Audience Size). |
| Engagement | The number of interactions (likes, comments, shares, saves) on your post. | Out of 3,000 people, 300 liked, commented, or shared your post. | How compelling your content is to the audience that saw it (Connection). |
Chasing only one of these metrics is a common mistake. An effective strategy aims for healthy numbers across the board. High impressions build brand recall, solid reach grows your audience, and strong engagement builds a loyal community.
For a deeper look at how platforms calculate these metrics differently, this article on Impressions vs Reach by Platform is an excellent resource.
All your social media in one simple dashboard
Schedule posts, track analytics, and reply to comments/DMs — without switching tabs.

Engagement
+18%
Views
52.8k
How Each Social Platform Counts Impressions (The Nuances)
Not all social media impressions are equal. Each platform has its own rules for what counts as a "view," and if you don't know the differences, you can't accurately compare your performance across channels. Understanding these platform-specific details is essential for effective reporting and strategy.
This section is your guide to how the major platforms—Instagram, Facebook, TikTok, X (Twitter), and LinkedIn—measure this key metric.
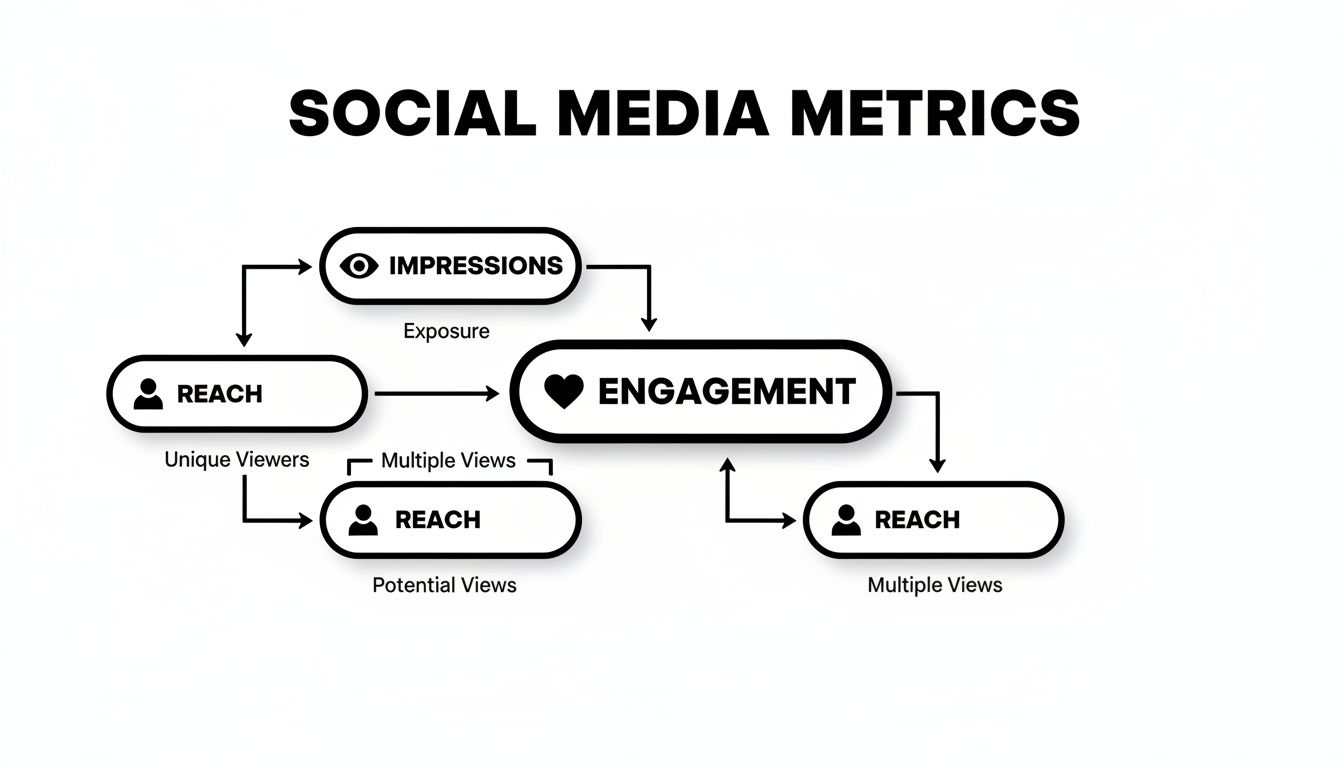
As this flowchart shows, impressions are the starting point. They represent every instance your content is seen, which is the foundation for reaching a unique audience and driving engagement.
Instagram Impressions (Now Called "Views")
Important 2026 update: Instagram renamed "Impressions" to "Views" across all content formats — Reels, Stories, feed posts, and carousels. The metric works the same way (total times your content was displayed on a screen), but the label in Instagram Insights now says "Views" instead of "Impressions." If you’re comparing Instagram data with other platforms, "Views" on Instagram = "Impressions" everywhere else.
Instagram provides detailed data showing you exactly where your views came from. A view is counted the moment a post is rendered on a user’s screen.
Here’s how Instagram breaks down views in your analytics:
- From Home: Views from people scrolling their main feed (your followers).
- From Hashtags: Views from users who found your post by searching for or following a specific hashtag.
- From Profile: Views from people who clicked on a post after visiting your profile page.
- From Explore: Views from the Explore page, a clear sign the algorithm is pushing your content to new accounts.
- From Other: A catch-all for views from shares in DMs, saved posts, or location tags.
For Reels and Stories, a view is counted almost instantly as the video begins playing. If your Explore views are low, our guide on the Instagram Reels algorithm explains how to get the platform’s discovery engine to work for you. For a deeper dive into what this metric means specifically for Instagram, see our guide on what are impressions on Instagram.
Facebook Impressions
Facebook defines an impression simply: it's registered as soon as a post enters a user's screen, even if they scroll past it immediately. This applies to both organic posts and paid ads.
Facebook categorizes impressions into two types:
- Organic: The total number of times your content was shown for free in the News Feed or on your Page.
- Paid: The number of times your paid ad was displayed. This is a primary metric for evaluating ad campaign delivery.
You may also encounter "served" vs. "viewed" impressions. A "served" impression means the ad was sent to the user's device, while a "viewed" impression confirms it appeared on their screen. The number you see in your Ads Manager is for viewed impressions.
X (Formerly Twitter) Impressions
On X, an impression is counted any time a user sees your post, whether in their main timeline, a search result, or on a profile. It’s a straightforward count of how many times your content has been displayed.
Visibility on X has increased significantly. According to recent data, the average post on X receives 2,121 impressions, a 75.8% year-over-year increase from 1,206 impressions in 2023. This highlights how algorithm changes have amplified content on the platform. With over 5.24 billion global social media users as of February 2025, impressions are a key driver of organic reach. You can find more of these social media statistics from Hootsuite.
TikTok Impressions
On TikTok, impressions are called "Video Views." A view is counted the moment a video starts playing on a user's For You Page, Following feed, or profile. There is no minimum watch time required.
A key limitation: On TikTok, every loop or replay of your video counts as a new view (impression). This is why a video's impression count can be much higher than its reach—one person watching on repeat can generate dozens of impressions. This dynamic is a major reason why TikTok numbers often appear inflated compared to other platforms.
LinkedIn Impressions
LinkedIn is stricter. It only counts an impression when your content is at least 50% visible on a member's screen for a minimum of 300 milliseconds. This follows the official IAB/MRC viewability standard, which is more rigorous than most other social networks.
This higher standard means a LinkedIn impression is often considered more valuable, as it helps ensure a user had a genuine opportunity to see your post. This rule applies to all content types, including text updates, images, articles, and videos.
Actionable Steps to Increase Your Impressions
Now that you understand what impressions are and how platforms count them, it's time to put that knowledge into action. This is a practical playbook for increasing your visibility and getting your content in front of a larger audience.
Step 1: Optimize Your Posting Times
The first few hours after you post are critical. Strong initial engagement signals to the algorithm that your content is valuable, prompting it to show your post to more users. Posting when your audience is most active gives your content the best chance to gain early momentum.
Here’s how to find your optimal posting times:
- Analyze your native analytics. Most platforms provide this data. On Instagram, go to your
Professional Dashboard>Total Followersand scroll to the bottom. In Facebook’sMeta Business Suite, find this information in theInsightstab. - Test and measure. Your analytics provide a starting point, but real-world testing is necessary. Experiment by posting at different times—including outside of peak hours—and track which slots deliver the biggest impression boost in the first 1-3 hours.
- Schedule for consistency. Once you've identified your best times, consistency is key. Manually posting at the perfect moment every day isn't practical. A scheduling tool like PostPlanify allows you to set your content to go live automatically during these peak windows, ensuring you never miss the initial engagement wave.
Step 2: Use Hashtags Strategically for Discovery
Hashtags function as a search engine for social media, categorizing your content and making it discoverable to users who don't follow you yet. This is one of the most effective ways to increase impressions, particularly from sources like Instagram's "From Hashtags" metric.
Here’s how to build a hashtag strategy that works:
- Be Specific and Relevant: Avoid overly broad tags like
#marketing. Instead, use niche hashtags that accurately describe your post, such as#saascontentstrategyor#smallbizsocialtips. - Mix Hashtag Sizes: Use a combination of hashtag sizes. Blend a few popular tags (1M+ posts) with some moderately popular ones (100k-500k posts) and a good number of niche tags (under 50k posts). This strategy gives you a chance to appear in high-traffic searches while also dominating smaller, more relevant conversations.
- Research and Rotate: Do not use the same block of 30 hashtags on every post. This can appear spammy to the algorithm. Create several lists of targeted hashtags and rotate them based on the specific content of each post.
Common Mistake: Using only massive hashtags. A tag with 10 million posts has a huge audience, but your content will be buried in seconds. Niche tags give your posts a longer shelf life and connect you with users who are genuinely interested in your topic.
Step 3: Prioritize High-Impression Content Formats
Some content formats are inherently better for discovery and sharing, which means they naturally generate more impressions. To maximize visibility, prioritize the content types that algorithms are actively promoting.
Here are the top-performing formats on each platform:
- Short-Form Video (Instagram Reels, TikTok, YouTube Shorts): These formats are designed for organic reach. Their algorithms serve engaging videos to new audiences on "For You" pages and discovery tabs. A single Reel can go viral and generate millions of impressions.
- Carousels (Instagram and LinkedIn): These multi-slide posts are engagement drivers. Because users spend more time swiping through them, it signals to the algorithm that your content is valuable. Instagram often shows the same carousel to a user multiple times, leading with a different slide each time, which can double the impressions from a single person.
- Polls and Quizzes (Instagram Stories, X, LinkedIn): Interactive content encourages user interaction. Every vote or answer provides a positive signal that can boost the visibility of your story or post, pushing it to more of your followers.
By focusing on these formats, you align your strategy with what the platforms themselves prioritize. For more ideas, read our guide on how to create engaging social media content.
Global social media advertising is projected to reach $276.7 billion in 2025, making up about 30% of all digital ad spending. This growth, driven by massive audiences on YouTube (2.53 billion ad reach) and Facebook (2.28 billion), shows how impressions directly impact business outcomes. With 5.42 billion users expected worldwide in 2025, every impression matters.
2026 Impression Benchmarks: What's "Good"?
Raw impression numbers mean nothing without context. Here are the benchmarks to measure your performance against, based on aggregated data from Buffer's 52M+ post analysis and Social Insider's 2026 benchmarks report.
Average Impressions by Platform
| Platform | Average Impressions per Post | What "Good" Looks Like | What "Great" Looks Like |
|---|---|---|---|
| Instagram (Feed Post) | 500-1,500 | 2x your follower count | 5x+ your follower count |
| Instagram (Reels) | 1,000-5,000 | 3x your follower count | 10x+ (viral territory) |
| Facebook (Page Post) | 200-800 | Reaching 10-15% of followers | Reaching 25%+ of followers |
| TikTok | 1,000-10,000 | 2x your follower count | 50x+ (FYP breakthrough) |
| X (Twitter) | 1,000-3,000 | 2,000+ per tweet | 10,000+ per tweet |
| 500-2,000 | 3x your connection count | 10x+ your connections |
Impression-to-Engagement Rate Benchmarks
Your impression count matters, but the ratio of impressions to engagement tells you about content quality:
| Platform | Average Engagement Rate (per impression) | Good | Excellent |
|---|---|---|---|
| 1.5-3% | 3-5% | 5%+ | |
| 0.5-1% | 1-2% | 2%+ | |
| TikTok | 3-6% | 6-10% | 10%+ |
| X (Twitter) | 0.5-1.5% | 1.5-3% | 3%+ |
| 2-4% | 4-6% | 6%+ |
How to use these benchmarks: If your impressions are high but engagement rate is below average, your content is visible but not compelling — focus on hooks, CTAs, and content quality. If your engagement rate is high but impressions are low, your content resonates but isn't being distributed — focus on hashtags, posting times, and format optimization.
Use an Instagram engagement calculator or TikTok engagement calculator to benchmark your rates instantly.
All your social media in one simple dashboard
Schedule posts, track analytics, and reply to comments/DMs — without switching tabs.
Engagement
+18%
Views
52.8k
How to Use Impression Data to Make Smarter Decisions
High impression numbers are only useful if they lead to better strategic choices. Think of your impression count as raw data—it’s what you do with it that matters. Analyzing this metric correctly helps you move beyond vanity numbers and uncover insights that drive your strategy forward.
The goal is to connect your content’s visibility to tangible business outcomes. A spike in impressions is a good start, but understanding why it happened is where the real value lies.
Identify Your High-Performing Content Pillars
Your analytics dashboard can reveal patterns in your top-performing content. Review your past posts and identify common threads among those with the highest impressions.
- Pinpoint Formats: Do videos consistently outperform images? Do carousels get more views than single-photo posts?
- Analyze Topics: Which subjects always generate high impressions? Is it educational content, user-generated features, or company news?
- Check Post Times: Do your highest-impression posts consistently go live around the same time of day?
By identifying these high-impression "pillars," you create a blueprint for future content, building on what has already proven to capture attention.
Track Impression Growth Over Time
A single impression number provides limited information. The real story emerges when you track this metric over weeks and months. Are your numbers increasing, staying flat, or declining?
Consistent growth indicates your strategy is working and that the algorithms are rewarding your efforts. A plateau or decline is an early warning sign that something needs to change—perhaps your content has become stale, or a platform's algorithm has shifted.
The number of social media users has grown from 970 million in 2010 to a projected 5.24 billion by February 2025. With an average of 8 new users every second as of April 2025, the competition for attention is intense. Understanding your historical impression trends is key to standing out. You can find the full report on these social media statistics at talkwalker.com.
Connect Impressions to Business Goals
This is the final step to move beyond vanity metrics. Impressions should be the start of the customer journey, not the end. Connect that initial visibility to actions that matter for your business.
Ask yourself these questions:
- Did that high-impression Instagram Reel lead to an increase in website clicks from your bio?
- Did that viral X post result in more sign-ups for your newsletter?
- Did your LinkedIn article with high impressions generate qualified leads?
A centralized analytics dashboard is a game-changer for this process. Instead of managing separate tabs for each platform, a tool like PostPlanify brings all your data into one place. It allows you to spot cross-platform trends and see the full picture—from the first impression to the final conversion.
By tying visibility to real results, you transform social media impressions from a simple number into a powerful diagnostic tool for your entire marketing funnel. For more guidance, see our deep dive on social media analytics and reporting.
Troubleshooting & FAQs About Social Media Impressions
Here are quick, direct answers to the most common questions about social media impressions.
Are More Impressions Always Better?
No. High impressions are only valuable when they come from the right audience and lead to engagement. It is better to get 1,000 impressions from potential customers than 10,000 impressions from people who will scroll right past. Success is about balancing visibility with relevance.
Why Did My Impressions Suddenly Drop?
A sudden drop in impressions usually has a clear cause. Don't panic; it's typically fixable once you identify the problem.
Here’s a troubleshooting checklist:
- Algorithm Changes: Platforms frequently update their algorithms, which can favor different types of content.
- Content Mismatch: If you changed your content style and it isn't resonating with your audience, engagement will drop, and the algorithm will show it less.
- Posting Inconsistency: If you stopped posting on your regular schedule, the algorithm might view your account as less active and reduce its promotion.
- Hashtag Issues: You might be using hashtags that are too broad, irrelevant, or have been flagged by the platform.
Compare your best-performing posts with your recent ones. The differences will often point you directly to the problem.
Is It Good to Have More Impressions Than Followers?
Yes, this is an excellent sign of organic growth. It means your content is reaching beyond your existing followers and is being discovered by new people. When your impression count exceeds your follower count, it's clear proof that the platform's algorithm is actively promoting your content on discovery surfaces like the Instagram Explore page or TikTok's For You Page.
How Often Should I Track Impression Metrics?
For day-to-day management, a weekly check-in is ideal. It's frequent enough to spot trends and make adjustments without getting lost in minor daily fluctuations. For reporting to clients or stakeholders, a monthly or quarterly report provides a clearer picture of long-term performance and growth.
What's the difference between impressions and views?
On most platforms, they mean the same thing — the total number of times your content was displayed. However, Instagram renamed "Impressions" to "Views" in 2026 across all formats (Reels, Stories, feed posts). TikTok has always called them "Video Views." When comparing cross-platform data, treat Instagram Views, TikTok Video Views, and impressions on Facebook/X/LinkedIn as equivalent metrics.
Do impressions count if someone doesn't stop scrolling?
It depends on the platform. LinkedIn requires your content to be at least 50% visible on screen for 300+ milliseconds — the strictest standard. Facebook counts an impression the moment your post enters the screen, even if the user scrolls past instantly. Instagram and X count similarly to Facebook. This means a LinkedIn impression is generally more "valuable" than a Facebook impression because it guarantees the user had a real chance to see your content.
Can I see who viewed my post (individual impressions)?
No. No social media platform shows you which specific accounts generated your impressions. You can see aggregate data — total impressions, breakdown by source (home, explore, hashtags), and demographic information about your audience — but not individual viewer identities. This is by design for user privacy.
How do paid impressions differ from organic impressions?
Organic impressions come from unpaid distribution — your followers' feeds, search results, explore pages, and shares. Paid impressions come from promoted posts and ads. Facebook and Instagram separate these in their analytics dashboards. Paid impressions typically have a known cost (CPM — cost per 1,000 impressions), while organic impressions are "free" but depend on algorithmic distribution. Most brands aim for a healthy mix of both.
What's a good impression-to-reach ratio?
An impression-to-reach ratio of 1.5 to 3.0 is typical and healthy. This means each unique person sees your content 1.5 to 3 times on average. Below 1.5 suggests your content isn't being shown repeatedly (low stickiness). Above 4.0 might indicate your content is being over-served to the same small audience instead of reaching new people. Check this ratio in your analytics to gauge whether the algorithm is expanding your audience or recycling the same viewers.
Do impressions affect the algorithm?
Not directly — impressions are an output of the algorithm, not an input. The algorithm decides how many impressions to give your content based on engagement signals: watch time, likes, shares, saves, and comments in the first 30-60 minutes. Higher early engagement → more impressions → more potential engagement → more impressions. This flywheel effect is why posting timing and hook quality matter so much.
All your social media in one simple dashboard
Schedule posts, track analytics, and reply to comments/DMs — without switching tabs.
Engagement
+18%
Views
52.8k
Quick Summary & Checklist
- Impressions vs. Reach: Impressions are total views; reach is unique viewers. Both are important.
- Platform Differences: Know how each platform (Instagram, Facebook, X, TikTok, LinkedIn) counts impressions to interpret your data accurately.
- Optimize Posting Times: Post when your audience is most active to maximize initial engagement.
- Use Hashtags Strategically: Mix broad and niche hashtags to increase discoverability.
- Prioritize High-Impression Formats: Focus on short-form video, carousels, and interactive content.
- Connect Impressions to Goals: Track how visibility translates to website clicks, leads, and sales.
- Troubleshoot Drops: If impressions fall, check for algorithm changes, content mismatches, or inconsistency.
Ready to stop guessing and start growing? PostPlanify provides the scheduling tools and unified analytics you need to boost your impressions and build your audience from one dashboard. Start your 7-day free trial today.
Related Reading
- What Are Impressions on Instagram?
- What Are Impressions on Twitter?
- Views vs Impressions: What's the Difference?
- How to Improve Social Media Engagement
- Social Media Analytics and Reporting
- How to Create Engaging Social Media Content
- Best Time to Post on Social Media
- Instagram Reels Algorithm: How It Works
- Social Media Post Ideas
- How to Measure Social Media ROI
- Instagram Engagement Calculator
- TikTok Engagement Calculator
All your social media in one simple dashboard
Schedule posts, track analytics, and reply to comments/DMs — without switching tabs.
Engagement
+18%
Views
52.8k
About the Author

Hasan Cagli
Founder of PostPlanify, a content and social media scheduling platform. He focuses on building systems that help businesses, agencies, and teams plan, publish, and manage content and social media more efficiently across platforms.


