
You know you need to track social media performance, but what does social media analytics actually mean for your business? It’s not about counting likes. It’s the process of collecting data from platforms like Instagram and LinkedIn and turning it into a clear roadmap for smarter marketing decisions.
This guide skips the theory and gets straight to practical solutions. You'll learn how to move beyond vanity metrics, understand what your numbers are really telling you, and connect your social media efforts directly to business growth.
Why "Likes" Aren't Enough: What Social Media Analytics Really Does

Chasing vanity metrics like follower counts feels productive, but it doesn't tell you if your strategy is actually working. Real social media analytics is about listening to what the data says about your customers, your content, and your bottom line.
Posting on social media without analyzing the results is like driving blindfolded. You're moving, but you have no idea if you're heading toward your destination or off a cliff. The data is your map and your speedometer.
Why You Can't Afford to Guess Anymore
Without a clear picture of performance, you can't justify your marketing budget, prove your team's value, or make informed decisions. The social media ad space is exploding—American businesses are projected to spend $88.3 billion on social ads in 2026, a huge jump from $56.7 billion in 2021.
That’s a 55.6% increase in just five years. With that much money on the line, you have to maximize your return, which is impossible without solid analytics. You can explore more social media statistics to understand these trends better.
Social media analytics transforms your strategy from "I think this will work" to "I know this will work because the data says so." It’s the difference between guessing and knowing.
By digging into the data, you solve real business problems:
- Problem: You can't prove your marketing ROI.
- Fix: Connect social media activities directly to website traffic, leads, and sales. This shows the C-suite exactly how your work contributes to revenue.
- Problem: You don't know what content to create.
- Fix: Identify which post formats, topics, and tones actually get a reaction. Stop wasting resources on content that falls flat and double down on what works.
- Problem: You're not sure where to invest your budget.
- Fix: Pinpoint which platforms and campaigns give you the best bang for your buck, allowing you to allocate time and money for maximum impact.
Making the shift from just posting to truly understanding performance is the single most important step you can take to level up your social media strategy.
Which Metrics Actually Matter for Business Growth?
Vanity metrics like follower counts are the sugar rush of social media analytics—they feel good for a moment but offer little substance. To understand what’s working, you must focus on numbers that tie your efforts back to tangible business outcomes.
The most important metrics fall into four categories that map to your customer's journey: Awareness, Engagement, Website Action, and Conversion.
1. Awareness Metrics: Is Anyone Seeing Your Content?
This is the top of your funnel—the first impression. Awareness metrics tell you how many people are seeing your content and how visible your brand is.
- Reach: The total number of unique people who saw your content. If 500 individual accounts saw your post, your reach is 500.
- Impressions: The total number of times your content was displayed. If those 500 people saw your post three times each, you'd have 1,500 impressions.
Why it matters: High impressions with low reach can mean a small, dedicated audience sees your content repeatedly. High reach with low impressions suggests you're getting in front of many new eyes but may not be holding their attention.
2. Engagement Metrics: Is Your Content Hitting the Mark?
Engagement metrics show that people are actively interacting with your content, not just scrolling past. It’s a powerful sign that your message is resonating.
Key engagement metrics include:
- Engagement Rate: The percentage of people who saw your post and took action (liked, commented, shared, saved). Calculated as
(Total Engagements / Total Impressions or Reach) x 100, this is the best single metric for gauging content quality. - Comments: A high-value engagement that requires more effort than a 'like'. Comments provide direct feedback and a channel for community building.
- Shares: A direct endorsement of your content to someone's personal network. This is a powerful form of organic reach. On X, this is a 'repost'; on Facebook, a 'share'.
3. Website Action Metrics: Are You Driving Traffic?
This is where your social media presence directly impacts your owned assets. These metrics track how effectively you move people from a social platform to your website or landing page.
A high click-through rate (CTR) is often more valuable than high impressions, especially if your goal is driving sales. It shows your call-to-action is compelling and your audience is motivated.
- Clicks: The total number of clicks on a link within your post. A simple measure of interest.
- Click-Through Rate (CTR): The percentage of people who saw your post and clicked the link. Calculated as
(Total Clicks / Total Impressions) x 100, a high CTR signals that your content and offer are highly relevant.
4. Conversion Metrics: Are You Generating Revenue?
This is the bottom line. Conversion metrics connect your social media activity directly to business goals like leads, sales, or sign-ups. Tracking this is non-negotiable for proving the financial value of your efforts. For a deeper dive, check out our guide on how to measure social media ROI.
Smart marketers track leads generated, cost per conversion, and revenue attributed to social media campaigns. This connects a simple post to actual sales. For creators and businesses evaluating where to invest their time, understanding which social media platform pays the most can help prioritize the channels with the highest monetization potential.
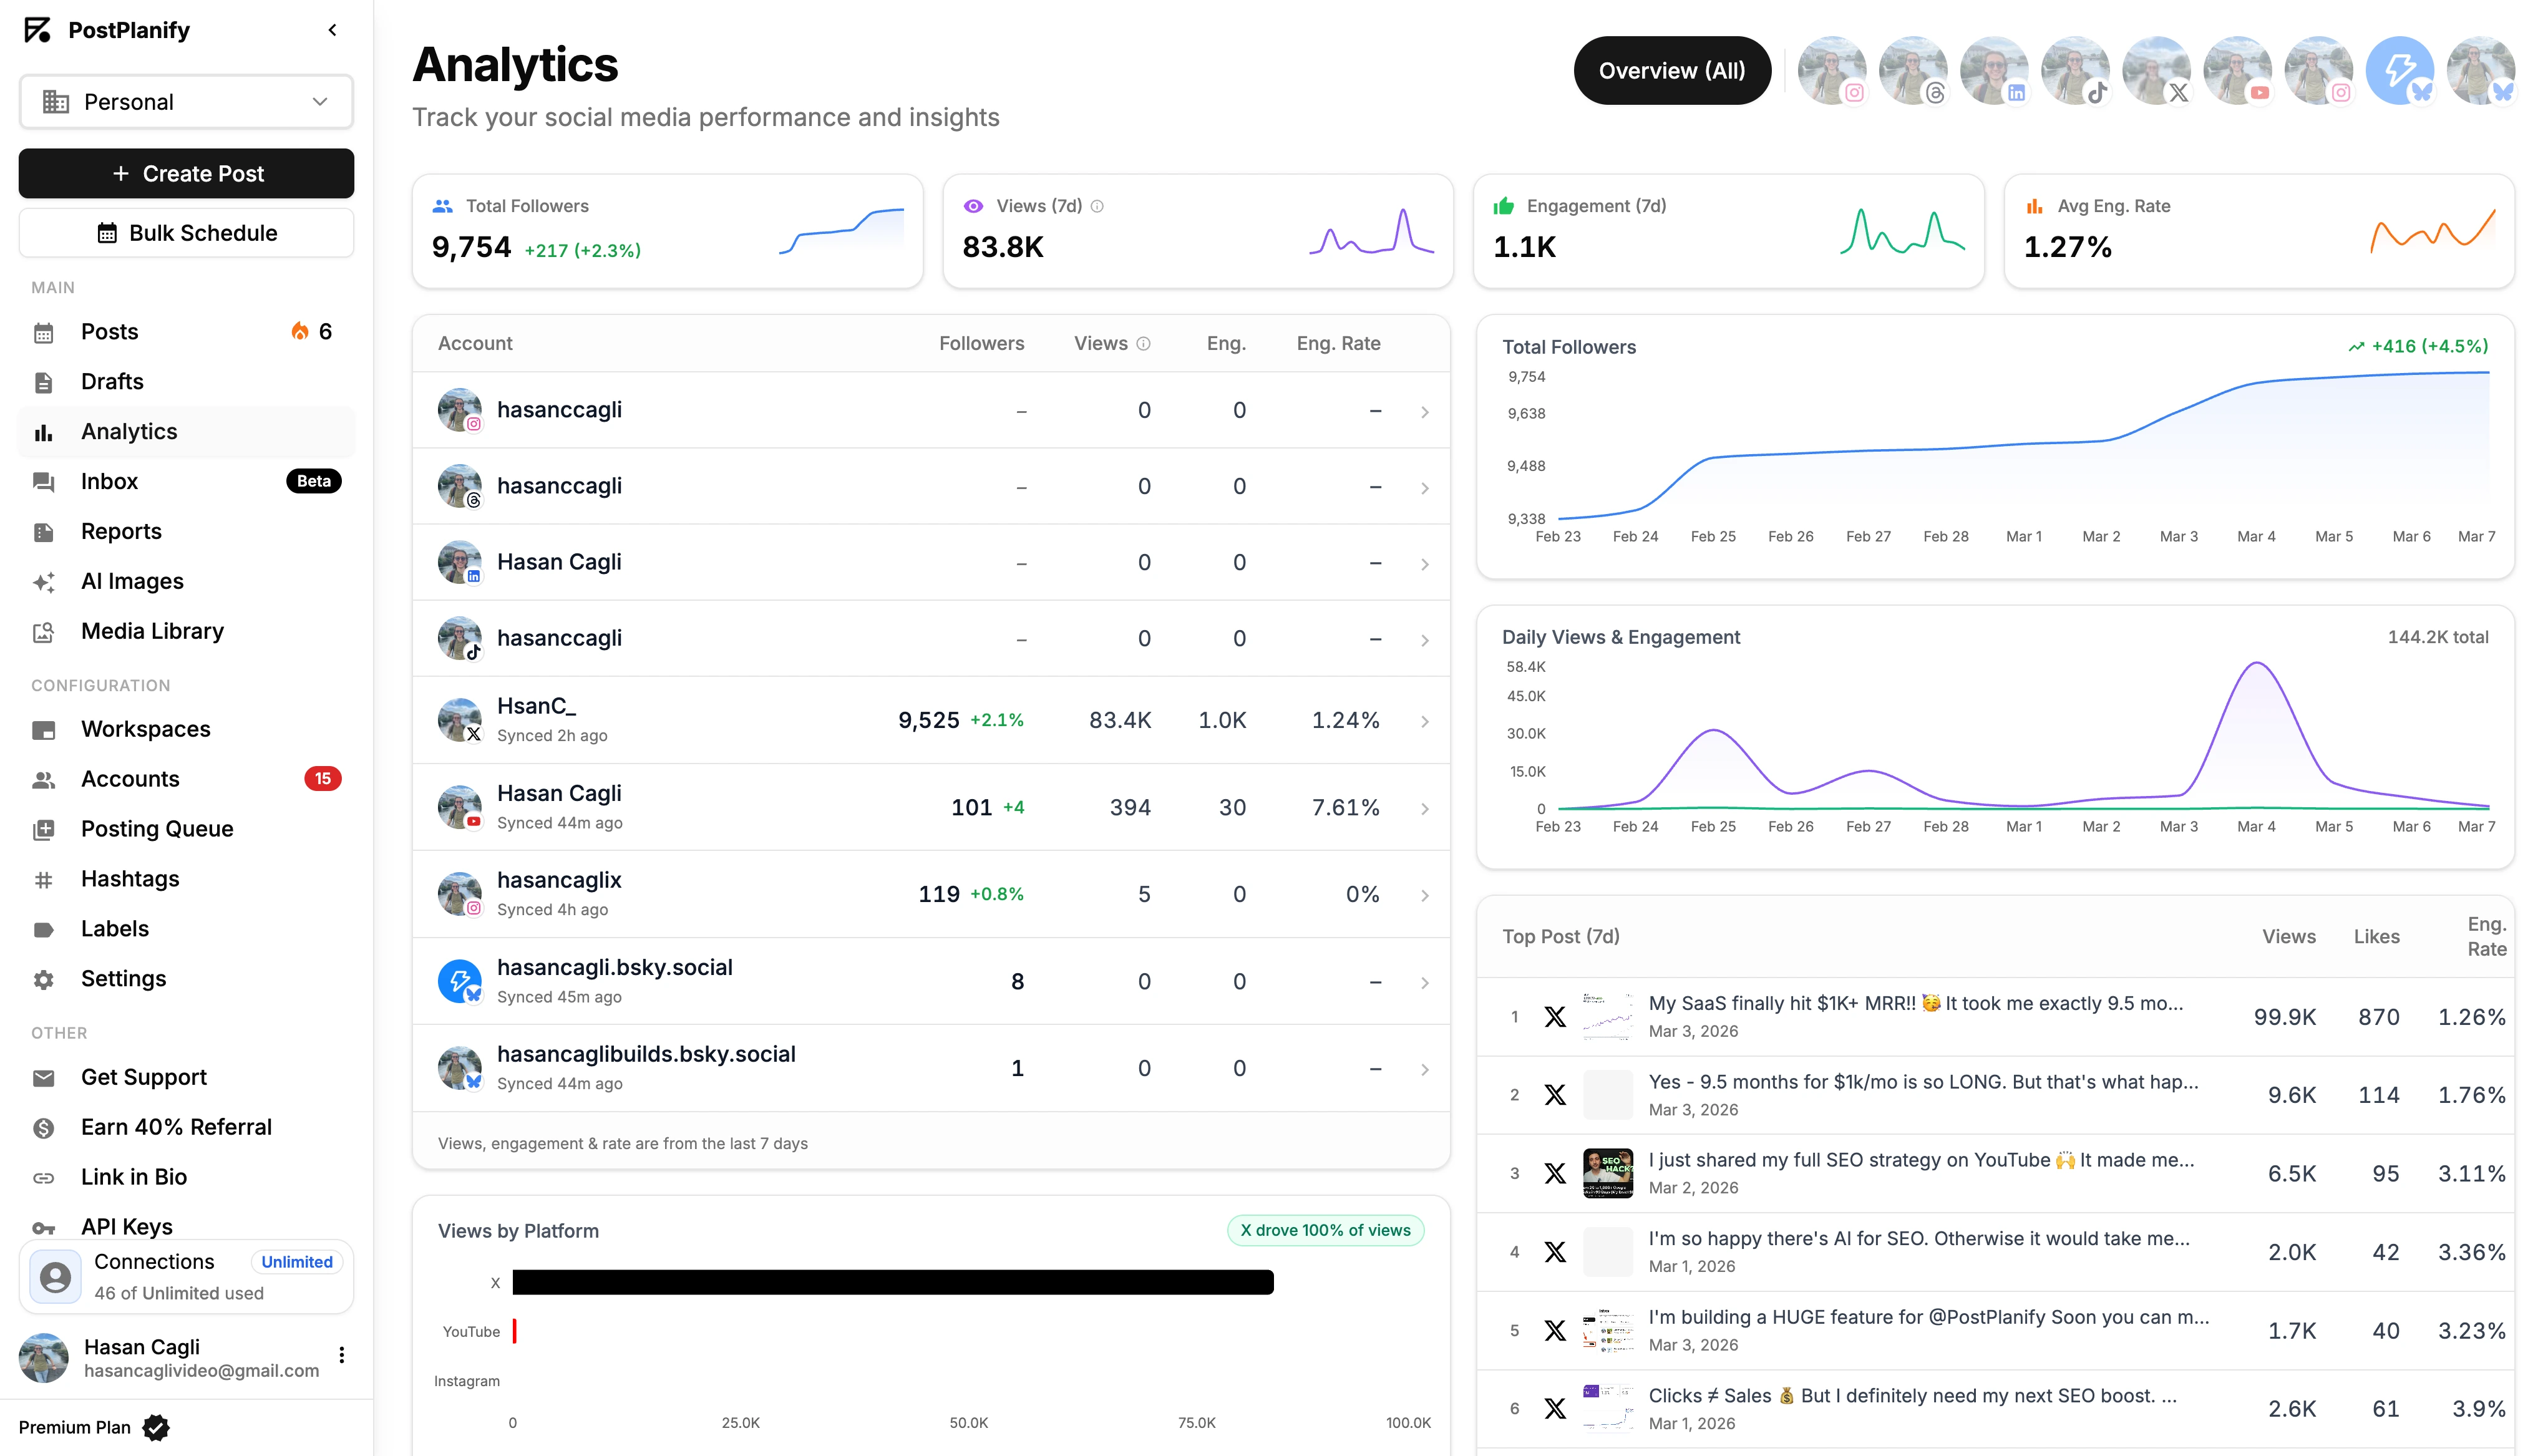
Using a platform like PostPlanify helps you monitor awareness and engagement metrics in one dashboard, making it easier to see what’s driving users toward crucial website actions and conversions.
All your social media in one simple dashboard
Schedule posts, track analytics, and reply to comments/DMs — without switching tabs.

Engagement
+18%
Views
52.8k
Below is a quick-reference table breaking down these core metrics.
Key Social Media Metrics and Their Business Impact
| Metric Category | Specific Metric | What It Measures | Why It Matters for Business |
|---|---|---|---|
| Awareness | Reach | The number of unique people who see your content. | Shows the total size of your potential audience and brand visibility. |
| Awareness | Impressions | The total number of times your content is displayed. | Indicates content frequency and how often your message is seen. |
| Engagement | Engagement Rate | The percentage of viewers who interact with your post. | The best indicator of content quality and audience resonance. |
| Engagement | Comments & Shares | Direct interactions and endorsements from your audience. | Signals strong community health and provides qualitative feedback. |
| Website Action | Click-Through Rate (CTR) | The percentage of viewers who click a link in your post. | Measures how effective your call-to-action is at driving traffic. |
| Conversion | Conversions | The number of desired actions taken (e.g., sales, sign-ups). | Directly connects social media activity to bottom-line business goals. |
Tracking these metrics isn't just about collecting data; it's about understanding the story your audience is telling you so you can make smarter decisions.
How to Analyze Performance on Each Social Platform
A killer Instagram strategy can completely bomb on LinkedIn. Each platform is a unique ecosystem with its own algorithm, audience behaviors, and native analytics tools. You have to analyze each one on its own terms.
This flowchart shows how separate platform efforts—building awareness and driving engagement—funnel into tangible business growth.
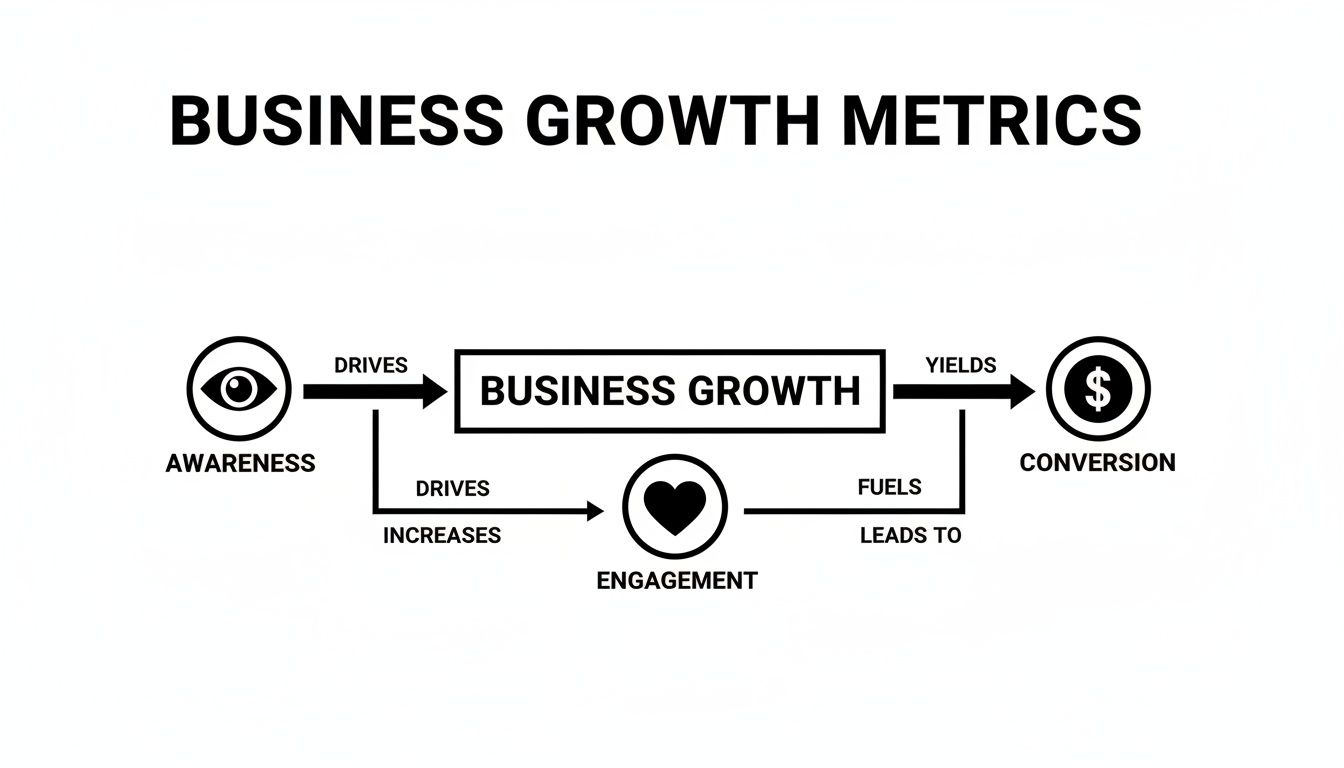
Let's break down the specific analytics that matter on each major platform.
Instagram Insights: Tracking Visual Impact
Instagram is about visuals and community. Its analytics, found in the "Professional Dashboard" on business or creator accounts, reflect that.
- Saves: When someone saves your post, they're telling the algorithm your content is valuable enough to revisit. It’s one of the strongest signals of high-quality, useful content.
- Shares: A share to a Story or DM is a personal endorsement. It’s how your content breaks out of your follower bubble and reaches new audiences organically.
- Profile Visits & Website Taps: These are your money metrics. They show how many people were inspired by your content to take the next step, whether that's checking out your brand or clicking the link in your bio.
Limitation: You can only access these insights with a business or creator account. If you're running a brand on a personal profile, switch it in your settings immediately.
Facebook Insights: Measuring Community and Conversions
Facebook is a powerhouse for building communities and driving traffic off-platform. Its analytics, found in Meta Business Suite, are robust.
- Post Reach vs. Impressions: Reach is how many unique people saw your post; Impressions is the total times it was seen. If impressions are high but reach is low, your core audience is seeing your post repeatedly, which could be a sign of content fatigue.
- Link Clicks: If you’re using Facebook to get people to your website and link clicks are low despite solid engagement, your call-to-action needs work.
- Video Metrics: Compare your 3-Second Video Plays to your ThruPlays (watched for at least 15 seconds). A massive drop-off between these two numbers is a clear sign your video intro isn't grabbing attention.
TikTok Analytics: Gauging Entertainment and Trends
On TikTok, it's about grabbing attention fast. The platform’s analytics, under "Creator Tools," show how well your videos perform in an endless scroll.
On TikTok, watch time is king. The algorithm heavily favors videos that keep users on the platform longer. A high average watch time tells TikTok your content is engaging and worth pushing to more "For You" pages.
- Average Watch Time: If your average watch time is just a few seconds on a minute-long video, you know your content isn't hitting the mark.
- "For You" Page Traffic Source: This percentage shows how much viewership comes from TikTok's discovery engine. A high number means you're successfully reaching new audiences.
- Follower Activity: Knowing when your audience is most active helps you get the initial burst of engagement the algorithm loves.
X (Twitter) Analytics: Analyzing Real-Time Conversations
X is for real-time news and quick-fire conversations. Its analytics (analytics.twitter.com) measure impact in a fast-moving timeline.
- Engagement Rate: Calculated by dividing all engagements (replies, reposts, likes, clicks) by total impressions. It's the cleanest way to measure how compelling your tweet was.
- Profile Clicks: A fantastic indicator of brand interest. It shows how many people saw a tweet and were intrigued enough to click through to your profile.
Limitation: X's data can sometimes be delayed, so you might see small differences between its native analytics and third-party tools.
LinkedIn Analytics: Understanding Professional Networks
LinkedIn is for B2B marketing and establishing industry leadership. Its analytics reflect this focus.
- Follower Demographics: LinkedIn tells you the job titles, industries, and company sizes of your followers, making it easy to see if you're reaching your target audience.
- Click-Through Rate (CTR): A direct measure of how well your content resonates with a professional audience and convinces them to take action.
Common Mistake: Don't compare LinkedIn's engagement rates to Instagram's. A handful of high-quality engagements from decision-makers can be far more valuable than thousands of likes from a general audience.
A tool like PostPlanify can pull these different metrics into one place, making it easier to see the big picture without drowning in browser tabs.
How to Build a Social Media Measurement Strategy
Great analytics starts with a plan, not a pile of data. Without a clear strategy, you’re just collecting numbers. A measurement strategy ensures every action has a purpose and leads to a specific outcome.
This framework is the difference between saying, “We got 1,000 likes,” and confidently stating, “Our campaign generated 50 qualified leads, contributing to a 15% increase in our sales pipeline this month.”
Step 1: Set S.M.A.R.T. Business Goals
Before looking at any metric, know what you're trying to achieve. Vague goals like "increase brand awareness" are impossible to measure. Use the S.M.A.R.T. framework to set clear targets.
- S - Specific: "Increase our average engagement rate on Instagram by 2%."
- M - Measurable: Define how you'll track progress with specific KPIs.
- A - Achievable: Set realistic goals. If you get 10 leads a month from social, aiming for 1,000 next month is not achievable.
- R - Relevant: Does the goal align with bigger business objectives? Will boosting TikTok followers support your B2B sales goals?
- T - Time-bound: Give yourself a deadline. "Increase our website CTR from LinkedIn by 5% over the next quarter (Q3)."
Step 2: Choose Your Key Performance Indicators (KPIs)
Once goals are set, pick the right KPIs to measure them. The goal is your destination; KPIs are the signposts.
- Goal: Increase Brand Awareness
- KPIs: Reach, Impressions, Follower Growth Rate.
- Goal: Drive Website Traffic
- KPIs: Clicks, Click-Through Rate (CTR), Website Sessions from Social.
- Goal: Generate Leads
- KPIs: Conversion Rate, Cost Per Lead (CPL), Form Fills.
Don’t track every metric. Pick a handful of primary KPIs for each goal to avoid analysis paralysis and keep your reporting focused.
Step 3: Set Up Social Media Attribution
Attribution connects a user's action (like a purchase) back to the specific social media touchpoint that influenced it.
The easiest way to solve this is with UTM parameters—small snippets of code added to a URL that tell your analytics tools exactly where a visitor came from. You can create these with a free UTM builder to track campaigns with precision.
For a more robust strategy, consider an analytics maturity model to guide your journey from basic tracking to advanced predictive analysis over time.
Step 4: Select the Right Analytics Tools
You can't manage what you don't measure. Your toolkit will likely be a mix of native and third-party platforms.
- Native Analytics: Every major platform (Instagram Insights, Meta Business Suite) offers free, built-in dashboards. These are great for platform-specific insights but are time-consuming to juggle.
- Third-Party Tools: A unified dashboard like PostPlanify pulls data from all your accounts into one place. This saves agencies and teams massive amounts of time by automating reporting and allowing easy cross-channel performance comparison. For a full market survey, see our guide to the best social media analytics tools in 2026 — it compares 11 platforms by pricing, AI features, and reporting depth.
How to Turn Data Into Actionable Reports
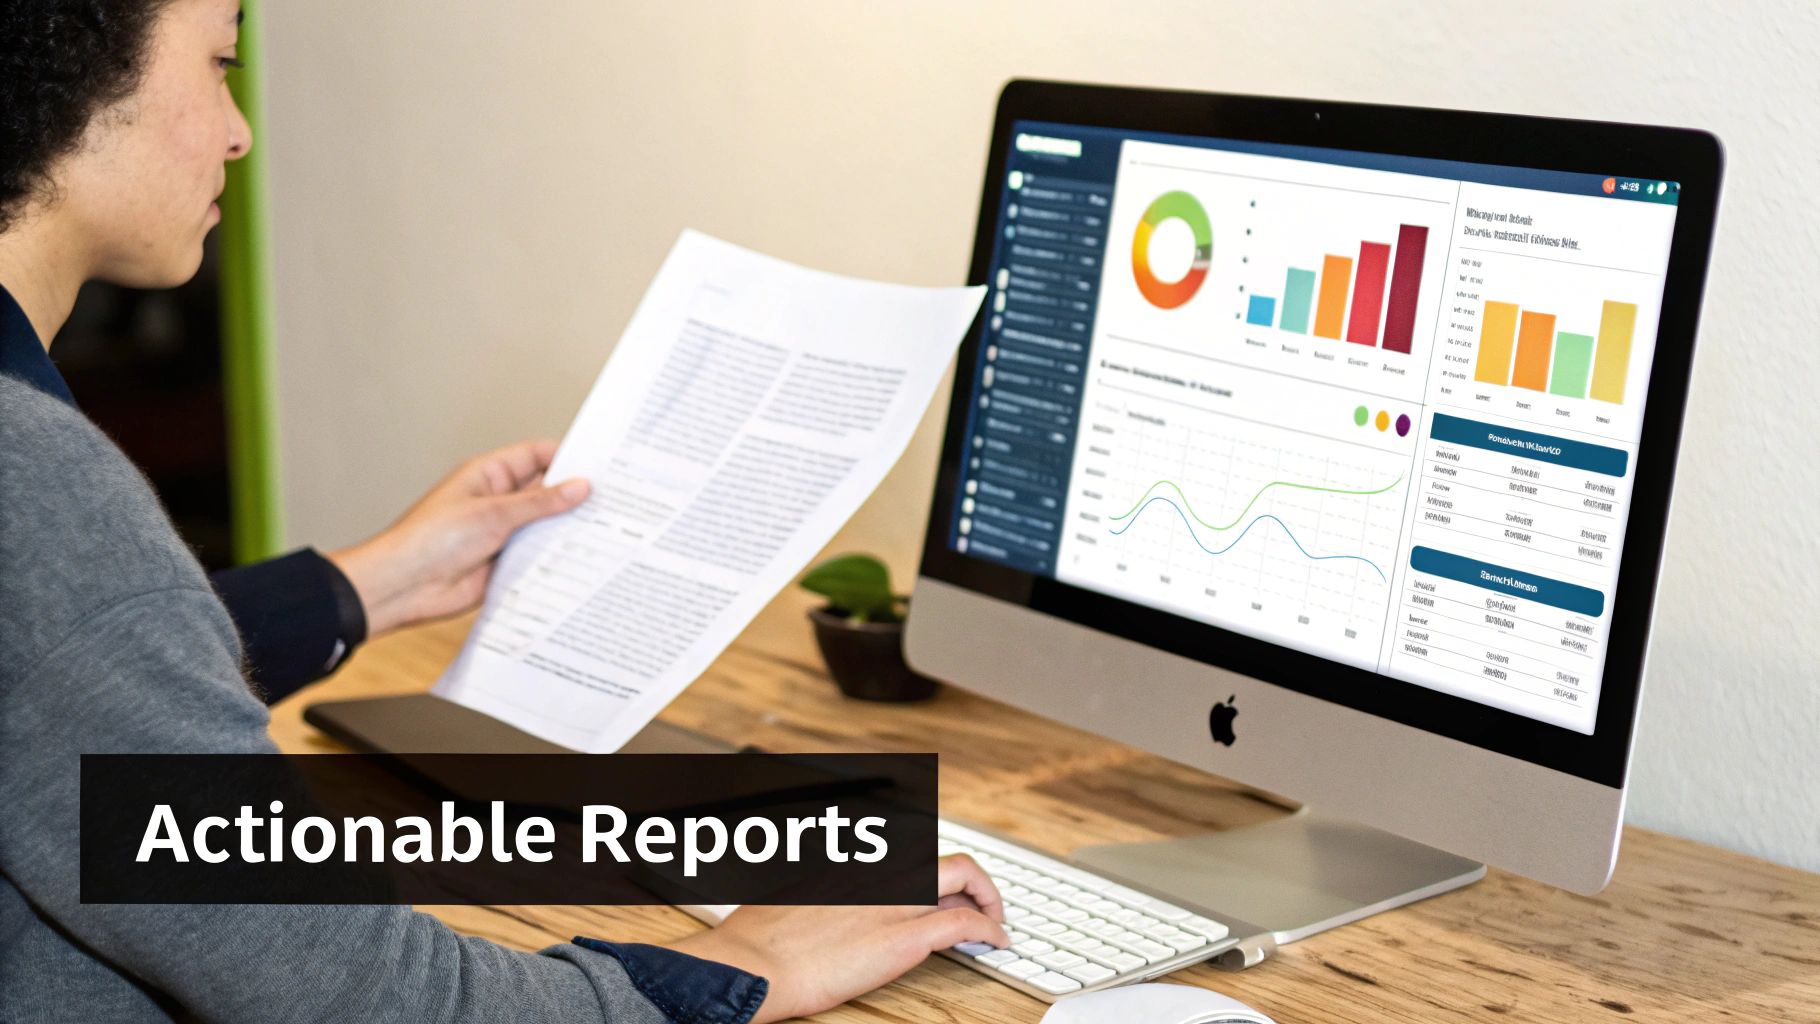
Raw data is just a pile of numbers. Its value comes from weaving it into a clear story that helps you make smarter decisions. Reports and dashboards transform dense analytics into a simple picture of what’s working, what’s not, and what to do next.
Tailor Reports for Different Audiences
Not everyone needs the same numbers. Tailor information to what your audience cares about.
- For the Executive Team (The "Why"): Leadership focuses on the bottom line. Their report needs to be short, highlighting high-level KPIs like ROI, cost per lead, and market share.
- For Clients (The "What"): Clients need to see progress. Reports should spotlight campaign performance, audience growth, and key wins against their targets.
- For Your Marketing Team (The "How"): Your team needs the nitty-gritty details. Their dashboard should have engagement rates, top-performing content, and platform-specific data to fine-tune their work.
Establish a Reporting Cadence
Consistency helps you spot trends and stay nimble. A solid cadence involves weekly, monthly, and quarterly reports, each with a different purpose.
A weekly report is a quick tactical check-in; a quarterly report is for deep strategic review. Don't just change the date range; change the focus.
Weekly Reports (Tactical Check-in) Quick snapshots to make small adjustments.
- Include: Top and bottom-performing posts, unusual spikes or dips, ad campaign pacing.
- Goal: Spot quick wins and catch small problems before they grow.
Monthly Reports (Performance Review) Zoom out to measure performance against monthly KPIs.
- Include: Progress toward goals, channel-by-channel performance, key takeaways.
- Goal: Understand what drove success and set priorities for the next month.
Quarterly Reports (Strategic Analysis) Big-picture reviews to assess overall strategy.
- Include: Summary of monthly trends, ROI deep dive, competitor benchmarking (tools like the Meta Ads Library can help you analyze competitor ad strategies), strategic recommendations.
- Goal: Make major strategic shifts and adjust your long-term plan.
From Numbers to Narrative: The "What, So What, Now What" Framework
The most powerful reports tell a story. For every key piece of data, include these three elements:
-
Observation (The "What"): State the key finding in plain language.
- Example: "Our engagement rate on Instagram jumped by 15% this month."
-
Insight (The "So What"): Explain why this matters.
- Example: "This growth was driven by our new carousel post format, which earned twice the saves of single-image posts."
-
Recommendation (The "Now What"): Propose a specific next step.
- Example: "We recommend shifting 25% more content production to carousel posts next month to build on this momentum."
This framework turns a dry data point into a compelling, action-oriented insight. A centralized dashboard in a tool like PostPlanify automates data collection, freeing you to focus on analysis and strategy, not data entry.
Troubleshooting: Common Social Media Analytics Pitfalls
Getting analytics right means sidestepping common traps that lead to bad conclusions and wasted effort. Here are the most frequent mistakes and how to fix them.
Problem: You're Only Focusing on Vanity Metrics
This is the number one mistake: chasing numbers that feel good but mean little, like follower counts or raw impressions. A post with 10,000 impressions looks great, but if it only drove two website clicks, what did it accomplish? You can learn more about the nuances of these metrics in our guide on what impressions on Instagram mean.
How to Fix It:
- Tie Metrics to S.M.A.R.T. Goals: If your goal is to generate leads, your primary KPI is conversion rate, not likes.
- Prioritize Action Metrics: Focus on numbers that show meaningful action: Click-Through Rate (CTR), Saves, Shares, and Conversion Rate.
- Use a Unified Dashboard: Tools like PostPlanify help you see the entire customer journey, from awareness to conversion, not just the fluffy numbers at the top.
Problem: You're Ignoring Negative Feedback
Ignoring negative comments and poor sentiment scores is a massive missed opportunity. This feedback is often the most honest insight you’ll get from customers, highlighting product flaws, service gaps, or messaging that isn't landing right.
Ignoring negative sentiment is like ignoring a check engine light. The problem won't go away and will likely get worse.
How to Fix It:
- Track Sentiment Actively: Use social listening tools to monitor brand mentions and categorize sentiment as positive, neutral, or negative to spot trends.
- Analyze the "Why": Don't just see a negative comment; dig into its root cause. Is it a recurring complaint? A simple misunderstanding?
- Respond Constructively: Always address complaints publicly and professionally. This shows the original commenter and everyone else watching that you care about their experience.
Social Media Analytics FAQ
Here are straight answers to the most common questions about social media analytics.
How often should I check my analytics?
There’s a difference between checking in and deep analysis.
- Daily/Few Times a Week (5-10 mins): A quick health check to spot anything urgent, like a failing ad campaign or a viral post.
- Weekly/Monthly (1-2 hours): Real analysis to identify trends and report on performance against KPIs.
- Quarterly (Half-day): Big-picture strategic review to assess overall strategy and plan for the next quarter.
What’s the difference between Reach and Impressions?
- Reach is the number of unique people who saw your content. If 100 individual people saw your post, your reach is 100.
- Impressions are the total number of times your content was displayed. If those 100 people saw your post twice, you’d have 200 impressions.
High impressions with low reach means a small group is seeing your content repeatedly. This could be a sign of a highly engaged audience or content fatigue.
Why do my numbers look different across different tools?
It's normal for numbers in Instagram Insights not to perfectly match what you see in PostPlanify or Google Analytics. This happens for a few reasons:
- Different Definitions: Platforms have slightly different rules for what counts as a "view" or "engagement."
- API Limitations: Third-party tools pull data from each platform’s API, which can have slight delays or restrictions.
- Timezone Mismatches: If your tools are set to different timezones, your daily or weekly numbers will never align perfectly.
The Fix: Pick one platform—like a unified dashboard—as your single source of truth for reporting. This ensures you're always comparing apples to apples.
Your Social Media Analytics Checklist
- Set S.M.A.R.T. goals before you track anything.
- Choose KPIs that directly measure progress toward those goals.
- Analyze each platform's unique metrics (e.g., Saves on Instagram, Watch Time on TikTok).
- Use UTM parameters to track website traffic and conversions accurately.
- Establish a reporting cadence (weekly, monthly, quarterly) tailored to different audiences.
- Turn data into a story using the "What, So What, Now What" framework.
- Avoid vanity metrics and focus on numbers that prove business impact.
All your social media in one simple dashboard
Schedule posts, track analytics, and reply to comments/DMs — without switching tabs.
Engagement
+18%
Views
52.8k
About the Author

Hasan Cagli
Founder of PostPlanify, a content and social media scheduling platform. He focuses on building systems that help businesses, agencies, and teams plan, publish, and manage content and social media more efficiently across platforms.


