
Staring at a social media report that’s just a list of follower counts and likes? You already know it’s not telling the whole story. A report that just dumps data doesn’t prove your work has value. A great social media report tells a clear story, connects your efforts to real business impact, and gives you a roadmap for what to do next. This guide will show you exactly how to create one, step-by-step.
Quick Answer: How to Create a Social Media Report
Here’s the high-level process — we’ll break each step down in detail below:
- Set SMART goals tied to business outcomes (leads, traffic, sales — not just "more engagement").
- Choose KPIs that directly measure those goals (CTR, CPL, ROAS, engagement rate).
- Gather data from native platform analytics or a centralized dashboard.
- Lead with an executive summary — the bottom-line results your stakeholders care about.
- Break down performance by platform, top content, and audience growth.
- End with actionable recommendations backed by specific data points.
The difference between a forgettable report and a strategic one? It’s not more data — it’s connecting that data to what the business actually cares about.
Why Your Current Reports Aren’t Working
Many social media managers and agencies fall into the "data dump" trap: creating reports packed with numbers but empty of meaning. The problem isn't the data itself; it's the failure to connect social media activity to tangible business outcomes like leads, website traffic, or sales.
When a report only shows a 2% follower increase, it’s nearly impossible for an agency to justify its fees to a client. It just doesn't feel impactful. Likewise, a marketing manager can't walk into a budget meeting and ask for more resources if their report doesn't link a spike in Instagram engagement to a rise in e-commerce conversions. Your stakeholders don't just want to know what happened; they need to understand why it happened and what it means for the business.
The Focus on Vanity Metrics
Problem: The most common mistake is obsessing over vanity metrics. These are numbers that look good on the surface—likes, follower counts, impressions—but often have a weak connection to actual business goals.
Real-world scenario: A post with a ton of likes feels like a win, but it doesn't automatically translate to customer loyalty or revenue. A post might go viral on TikTok and get millions of views, but if it doesn't drive any traffic to your product page or generate a single lead, its business value is close to zero.
Actionable Fix: Focusing on vanity metrics can give you a false sense of security and send your strategy in the wrong direction. A strong report looks past these surface-level stats to highlight metrics that truly matter, like conversion rates, click-through rates (CTR), and cost per acquisition (CPA).
No Connection to Business Goals
Problem: Another huge issue is when social media efforts aren't tied directly to the company's bigger goals. Your social media strategy shouldn't exist in a silo; it must be an integral part of your company's marketing and sales funnel.
Real-world scenario: A report that doesn’t connect social performance to business outcomes is just a list of statistics. To prove your value, you must draw a clear line from a LinkedIn post to a new B2B lead, or from an Instagram Reel to a product sale.
Actionable Fix: This disconnect often happens when goals are vague, like "increase engagement." A much better approach is to set specific, measurable objectives. Instead of just aiming for more engagement, a better goal is to increase website referral traffic from Facebook by 15% in the next quarter. This immediately makes your reporting more focused and demonstrates a clear return on your efforts. You can find more details on this topic in our guide to social media analytics and reporting.
It's no surprise that the demand for tools that help create these kinds of insightful reports is exploding. The social media management software market was valued at $28.58 billion in 2025 and is projected to hit $33.46 billion in 2026. This surge shows just how critical effective analysis has become. You can discover more insights about this market growth on The Business Research Company.
Connecting Social Media Goals to Business Outcomes
A social media report filled with likes and follower counts might look impressive, but it's useless if it doesn't connect back to what the business actually cares about: revenue, leads, and growth. Without that link, you're just presenting a page of numbers. A powerful report, on the other hand, draws a straight line from your activity on Instagram or LinkedIn to real business results.
For an e-commerce brand, that might mean showing how many sales came directly from an Instagram Shop. For a B2B company, it's about tracking the qualified leads generated from a LinkedIn whitepaper. This is how you transform a simple recap into a strategic document that proves your value—and secures your budget for next quarter.
Setting SMART Goals For Social Media
To get there, you need to ditch vague goals like "increase engagement." Instead, every objective needs to be SMART: Specific, Measurable, Achievable, Relevant, and Time-bound. This framework forces you to get crystal clear on what you’re trying to accomplish, making it a breeze to track and report on.
Let's look at the difference. A vague goal is "improve brand awareness." It's fuzzy and impossible to measure.
Now, let's make it a SMART goal:
- Specific: Increase brand awareness on TikTok among users aged 18-24 in the United States.
- Measurable: Achieve a 20% increase in video views and a 10% increase in profile visits.
- Achievable: This is realistic based on our previous 5% monthly growth rate.
- Relevant: This directly supports our wider business objective of capturing a younger market segment.
- Time-bound: We will hit this target by the end of Q3.
See the difference? This gives you a clear benchmark. At the end of Q3, you either hit that 20% increase or you didn't. There's no ambiguity.
Choosing KPIs That Align With Business Objectives
Once your goals are locked in, you need to pick the right Key Performance Indicators (KPIs) to measure them. These are the specific, trackable numbers that tell you if you're on the right path.
If your goal is to generate leads, you can't just report on likes and shares. Those are vanity metrics—they feel good but don't pay the bills. Instead, you need to focus on KPIs that truly matter for lead gen, like:
- Form Submissions: How many people actually filled out your lead form from a social post?
- Link Clicks to a Gated Asset: How many users clicked to download your new ebook?
- Cost Per Lead (CPL): What's the average cost to get one new lead from your social ads?
Knowing which numbers to track is fundamental. To really nail this down, it’s critical to understand how to measure social media ROI, which helps you tie every action back to a dollar value.
Without this focus, you end up with what we call the "Data Dump Dilemma"—a report that’s all noise and no signal.

As you can see, just throwing raw numbers or vanity metrics into a report without connecting them to a strategic purpose creates a document that fails to show any real impact.
Mapping Goals To Platform-Specific Metrics
Not all platforms are created equal, and your reporting needs to reflect that. A one-size-fits-all approach just won't cut it. You have to know where to look on each network to pull the data that actually tells the story.
To help you connect the dots, this table shows exactly how you can map high-level business goals to the specific KPIs available on different platforms.
| Business Goal | Corresponding KPI | Platform Examples (Facebook/Instagram, LinkedIn, TikTok) |
|---|---|---|
| Increase Brand Awareness | Impressions, Reach, Video Views | FB/IG: Post Reach, Video ThruPlays. LinkedIn: Post Impressions. TikTok: Video Views, Reach. |
| Drive Website Traffic | Outbound Clicks, Click-Through Rate (CTR) | FB/IG: Link Clicks from bio/Stories. LinkedIn: CTR on article shares. TikTok: Clicks on profile link. |
| Generate Leads | Conversion Rate, Cost Per Lead (CPL) | FB/IG: Leads from Lead Ads. LinkedIn: Lead Gen Form submissions, CPL. TikTok: Form submissions via landing page. |
| Boost Engagement | Engagement Rate, Comments, Shares | FB/IG: Post Interactions (likes, comments, shares). LinkedIn: Reactions, Comments. TikTok: Likes, Comments, Shares. |
| Increase Sales | Conversion Value, Return on Ad Spend (ROAS) | FB/IG: Website Purchases from ads, ROAS. LinkedIn: Conversions tracked via Insight Tag. TikTok: Add to Carts, Purchases. |
By breaking it down this way, you ensure every number in your report has a clear purpose and directly supports a larger business objective.
A good report needs to answer two questions: "What happened?" and, more importantly, "Why does it matter to the business?" Analyzing performance on a per-platform basis is what makes a report truly strategic.
For a much deeper dive into proving the bottom-line impact of your work, check out our complete guide on how to measure social media ROI. By tying your goals to these specific, measurable KPIs, you stop reporting on fluff and start demonstrating real, undeniable value.
Related: Social Media Analytics and Reporting | Social Media Analytics for Business | Best Time to Post on Social Media
All your social media in one simple dashboard
Schedule posts, track analytics, and reply to comments/DMs — without switching tabs.

Engagement
+18%
Views
52.8k
Gathering Your Data Without Getting Overwhelmed
You’ve set your goals and picked your KPIs. Now comes the part that trips up many social media managers: wrangling all the numbers. If you've ever felt like you spend half your day bouncing between different analytics dashboards, you know how frustrating it can be. It feels like a digital scavenger hunt, but it doesn’t have to be a nightmare.

The secret is knowing where to look and understanding the pros and cons of pulling data manually versus using a streamlined, automated approach.
Navigating Native Analytics Platforms
Every social media platform has its own free analytics dashboard. Getting comfortable with these native tools is a non-negotiable skill, as they give you a direct line to platform-specific data you can't get anywhere else.
Here’s a practical guide on where to find key data on each platform and what limitations to watch out for:
-
Meta Business Suite (Facebook & Instagram): Head to the "Insights" tab. This is your hub for Reach, Engagement, and Audience Demographics for both your Facebook Page and Instagram account.
- Pro: You can set custom date ranges.
- Limitation: Comparing Instagram growth directly to Facebook engagement side-by-side within the suite is clumsy. You'll need to export and combine data manually.
-
TikTok Analytics: Found in your profile settings, it’s broken down into Overview, Content, and Followers. It’s excellent for spotting viral trends and understanding when your audience is most active.
- Pro: Great for real-time trend analysis.
- Limitation: Data is often limited to the last 60 or 90 days, which is a major headache for quarterly or annual reporting. You must export data regularly to avoid losing it.
-
LinkedIn Page Analytics: This is where you’ll find solid B2B metrics. You can track Impressions, Click-through rates (CTR), and detailed Visitor and Follower demographics like job function and seniority.
- Pro: Invaluable for proving B2B value and understanding your professional audience.
- Limitation: The interface can be slow, and data exports are less comprehensive than other platforms.
-
X (formerly Twitter) Analytics: Located at
analytics.twitter.com, it provides a monthly snapshot of your top tweets and follower changes.- Pro: Useful for a quick monthly overview.
- Limitation: The interface is clunky, sometimes lags with data updates, and offers limited historical data for export.
These free tools are essential, but relying on them alone creates a massive bottleneck. Manually exporting CSVs from each platform and then trying to stitch them together in a spreadsheet is not just tedious—it’s a recipe for errors and wasted hours.
The Case for a Centralized Dashboard
This is exactly why dedicated social media management tools are so valuable. Instead of logging into five different places, a centralized platform does the heavy lifting for you.
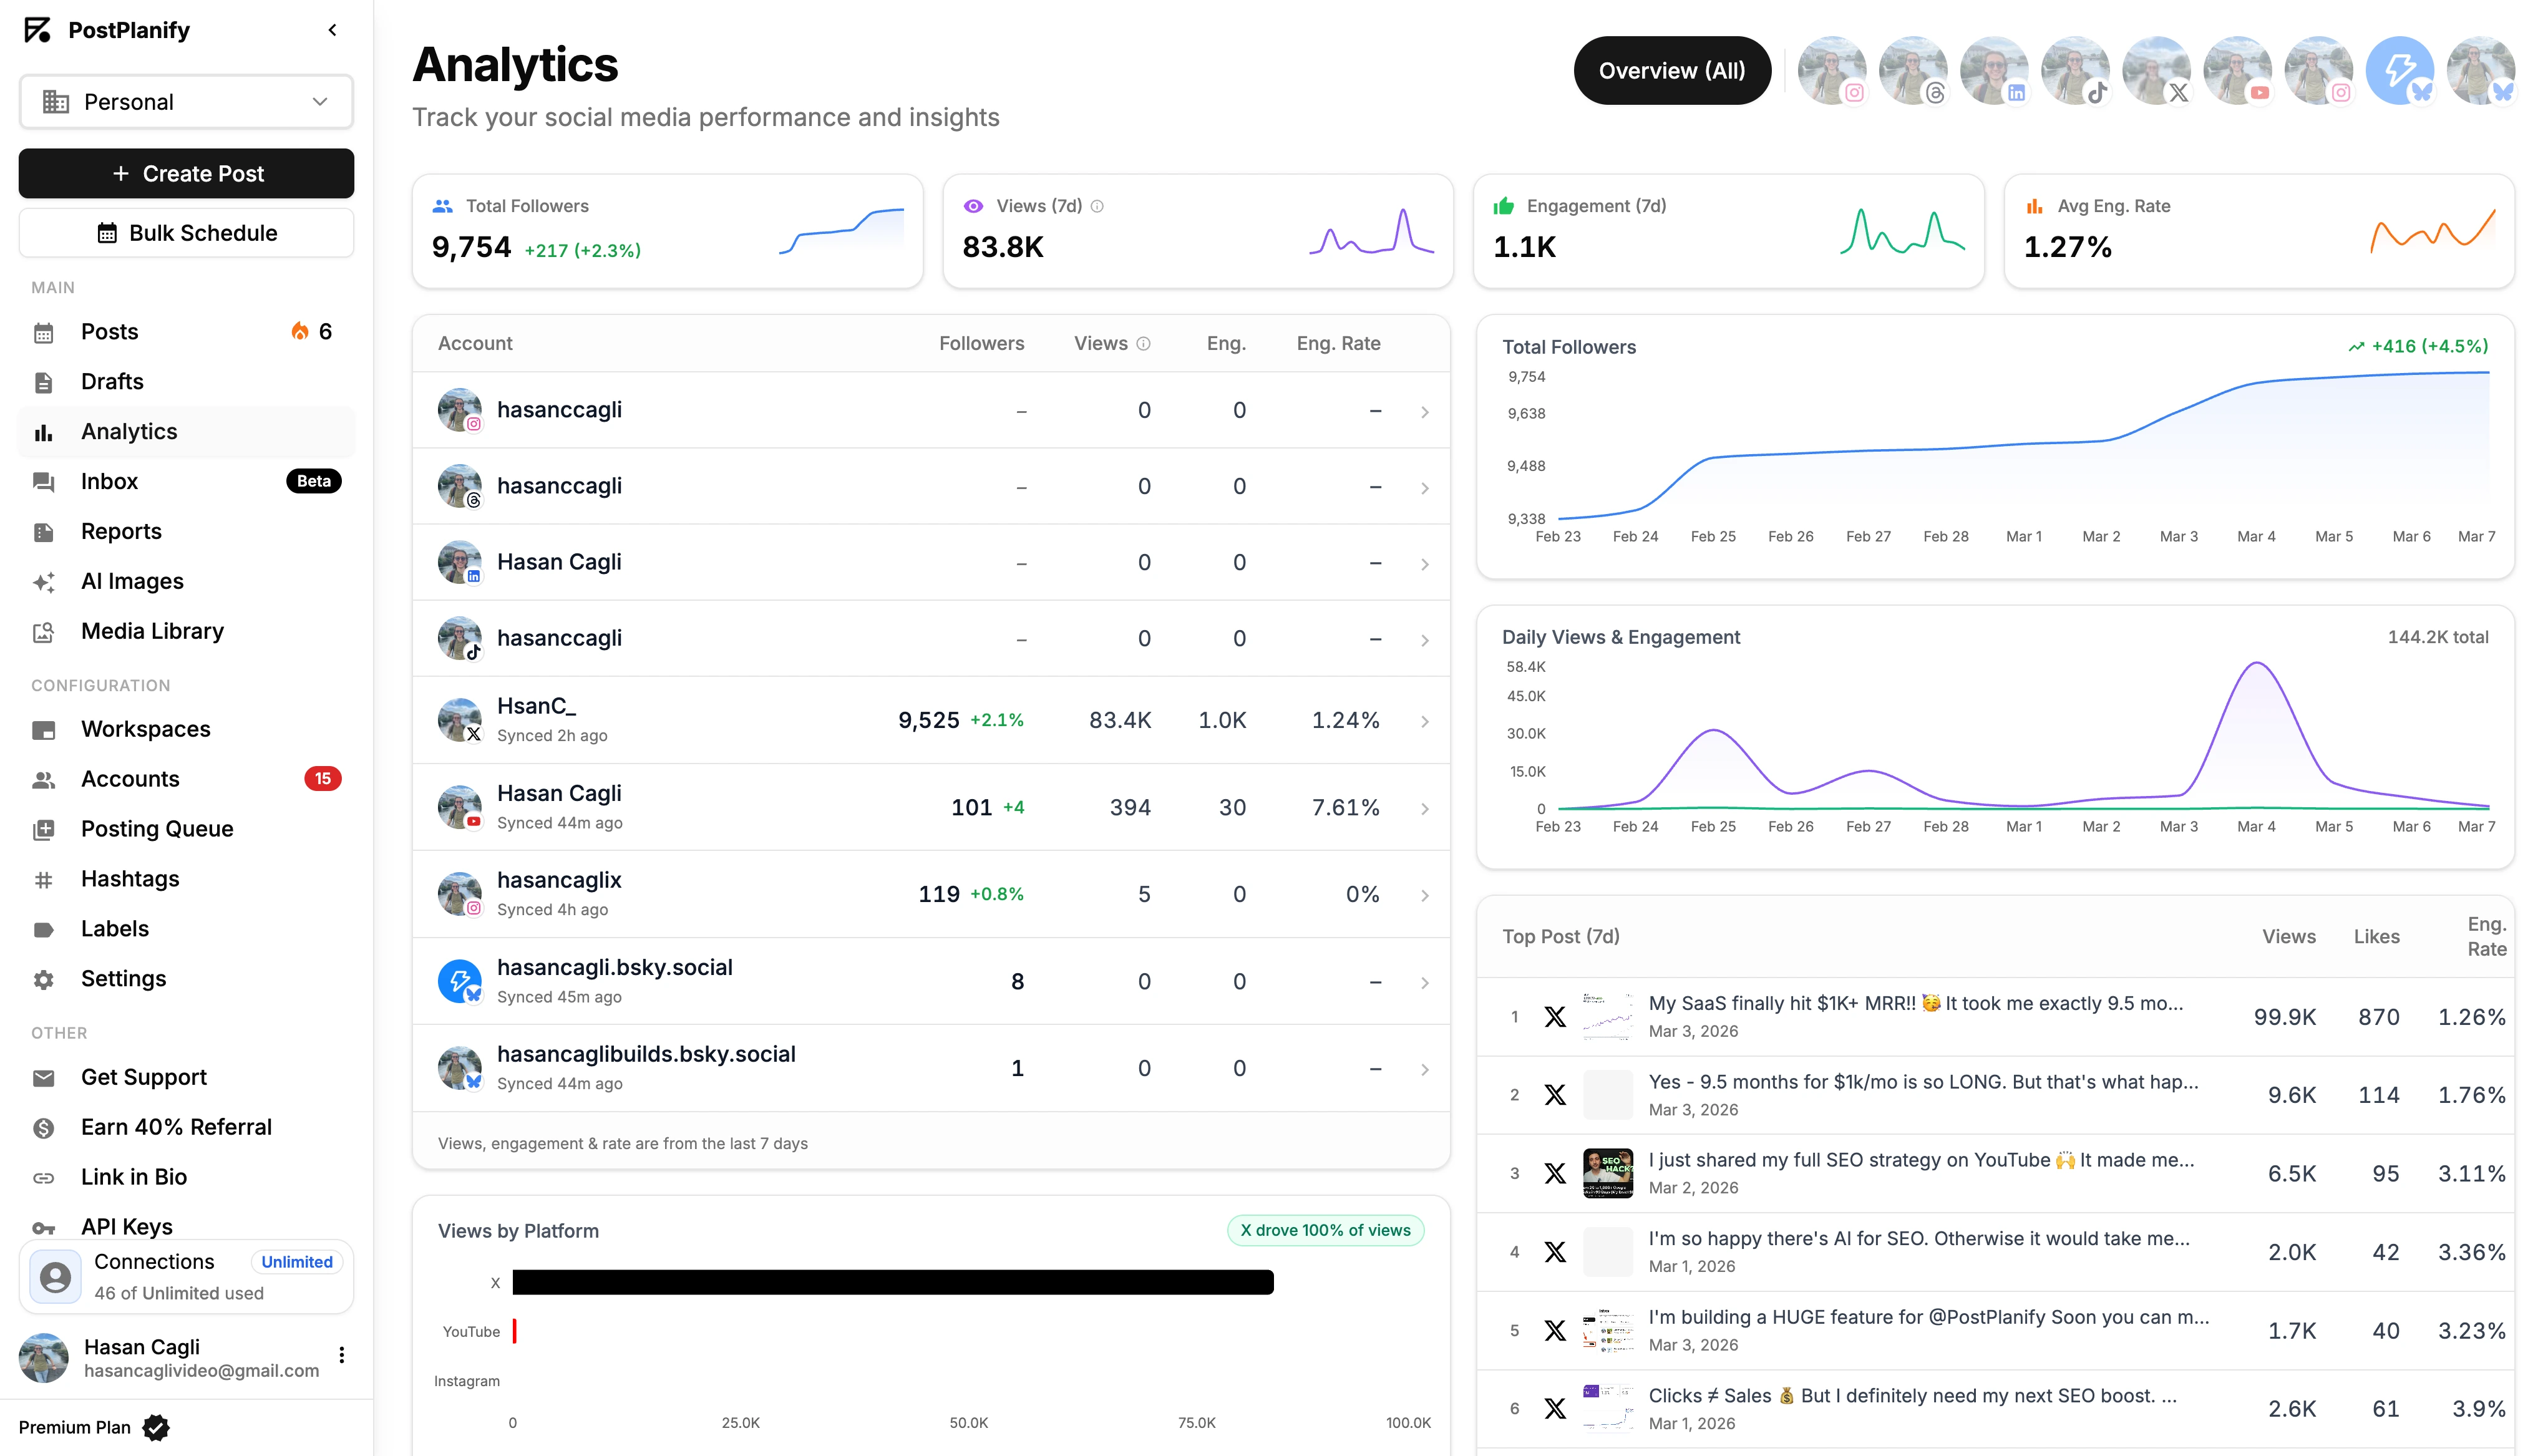
The real power of a centralized dashboard isn't just saving time—it's gaining the ability to see the entire landscape at once. You can instantly compare your Instagram engagement rate to your LinkedIn CTR without ever opening a spreadsheet.
For example, a tool like PostPlanify connects to all your social accounts and pulls the data into one clean, unified dashboard. This means your report data is always live and ready for analysis. You can build custom reports that mix and match metrics from different platforms, set any date range you need, and spot trends over time with just a few clicks.
The industry's projected market share of 76.48% for cloud-based tools by 2026 just shows how much agencies and businesses need this kind of streamlined reporting.
Your Data Collection Checklist
To keep things efficient, work from a checklist. Before you even open an analytics tab, have your list of goals and the metrics that measure them right in front of you.
Essential Data Points to Gather:
- Audience Growth: The net number of new followers or connections you gained on each platform.
- Reach & Impressions: How many unique people saw your content, and the total number of times it was displayed.
- Engagement Metrics: All the likes, comments, shares, saves, and reactions. Don’t forget to calculate the overall engagement rate for each platform.
- Website Traffic: Clicks from your bio link, in-post links, and Stories. Pro tip: Use UTM parameters so you can track this with pinpoint accuracy in Google Analytics.
- Content Performance: Pinpoint your top 3-5 posts on each platform based on the goal that matters most (e.g., engagement, clicks, or views).
Following a structured list like this ensures you don't get distracted by vanity metrics and forget something important.
If you really want to level up your data collection, running a periodic social media audit will help you cut through the noise and focus your efforts. To get even more qualitative insights, you can weave in strategies like social listening on YouTube to understand what your audience is really talking about.
Structuring Your Report for Maximum Clarity
You’ve gathered the numbers, but the real test is turning that data into a story your boss or client actually wants to read. A messy report, no matter how good the data, gets skimmed and forgotten. A clear structure transforms raw numbers into a persuasive narrative that proves your value and guides future strategy.

The goal here isn't just to make things look pretty. It's about building a document that anyone—from your direct manager to the CEO—can glance at and instantly understand the key takeaways.
Lead With a Strong Executive Summary
Every single report should start with an Executive Summary. Be realistic: many stakeholders will only read this part, so it has to be direct and impactful.
Think of it as the TL;DR (Too Long; Didn't Read) for your entire report. In a few bullet points or a short paragraph, answer these questions:
- What were our main goals for this period?
- Did we hit them? (e.g., "Achieved 115% of our lead generation target.")
- What were the biggest wins or most important learnings? (e.g., "Our new video series drove a 30% increase in engagement.")
- What’s the bottom-line takeaway for the business? (e.g., "Social media generated $5,000 in attributable revenue this month.")
This summary immediately tells the reader if you're on track and gives them the highlights upfront, inviting them to dive deeper if they have time.
Build the Body of Your Report
With the summary done, it’s time to break down the details. But don't just dump a list of metrics. Guide your reader through the data in a way that builds a compelling story.
A solid report structure usually flows like this:
- Performance Against KPIs: Start by directly addressing the goals you set. Show the target right next to the actual result. For example, if the goal was to drive 1,000 website clicks, make that comparison crystal clear: "Target: 1,000 clicks / Actual: 1,250 clicks."
- Platform-Specific Breakdowns: Your LinkedIn strategy is different from your TikTok strategy, and your report must reflect that. Dig into the metrics that matter for each individual network, explaining the performance in the context of that platform’s goals.
- Top-Performing Content: This is your highlight reel. Showcase the top 3-5 posts from the period and—most importantly—explain why they worked. Was it the video format, the direct call-to-action, the topic, or the time you posted?
- Audience Growth and Demographics: Go beyond just counting followers. Talk about your audience growth rate and any new insights. Did you attract a new demographic on Instagram? Did your follower quality on LinkedIn improve? This is the place to mention it.
- Key Learnings and Actionable Recommendations: This is where you connect the dots. Based on everything you just showed, what’s the plan? This section turns your report from a historical document into a strategic roadmap.
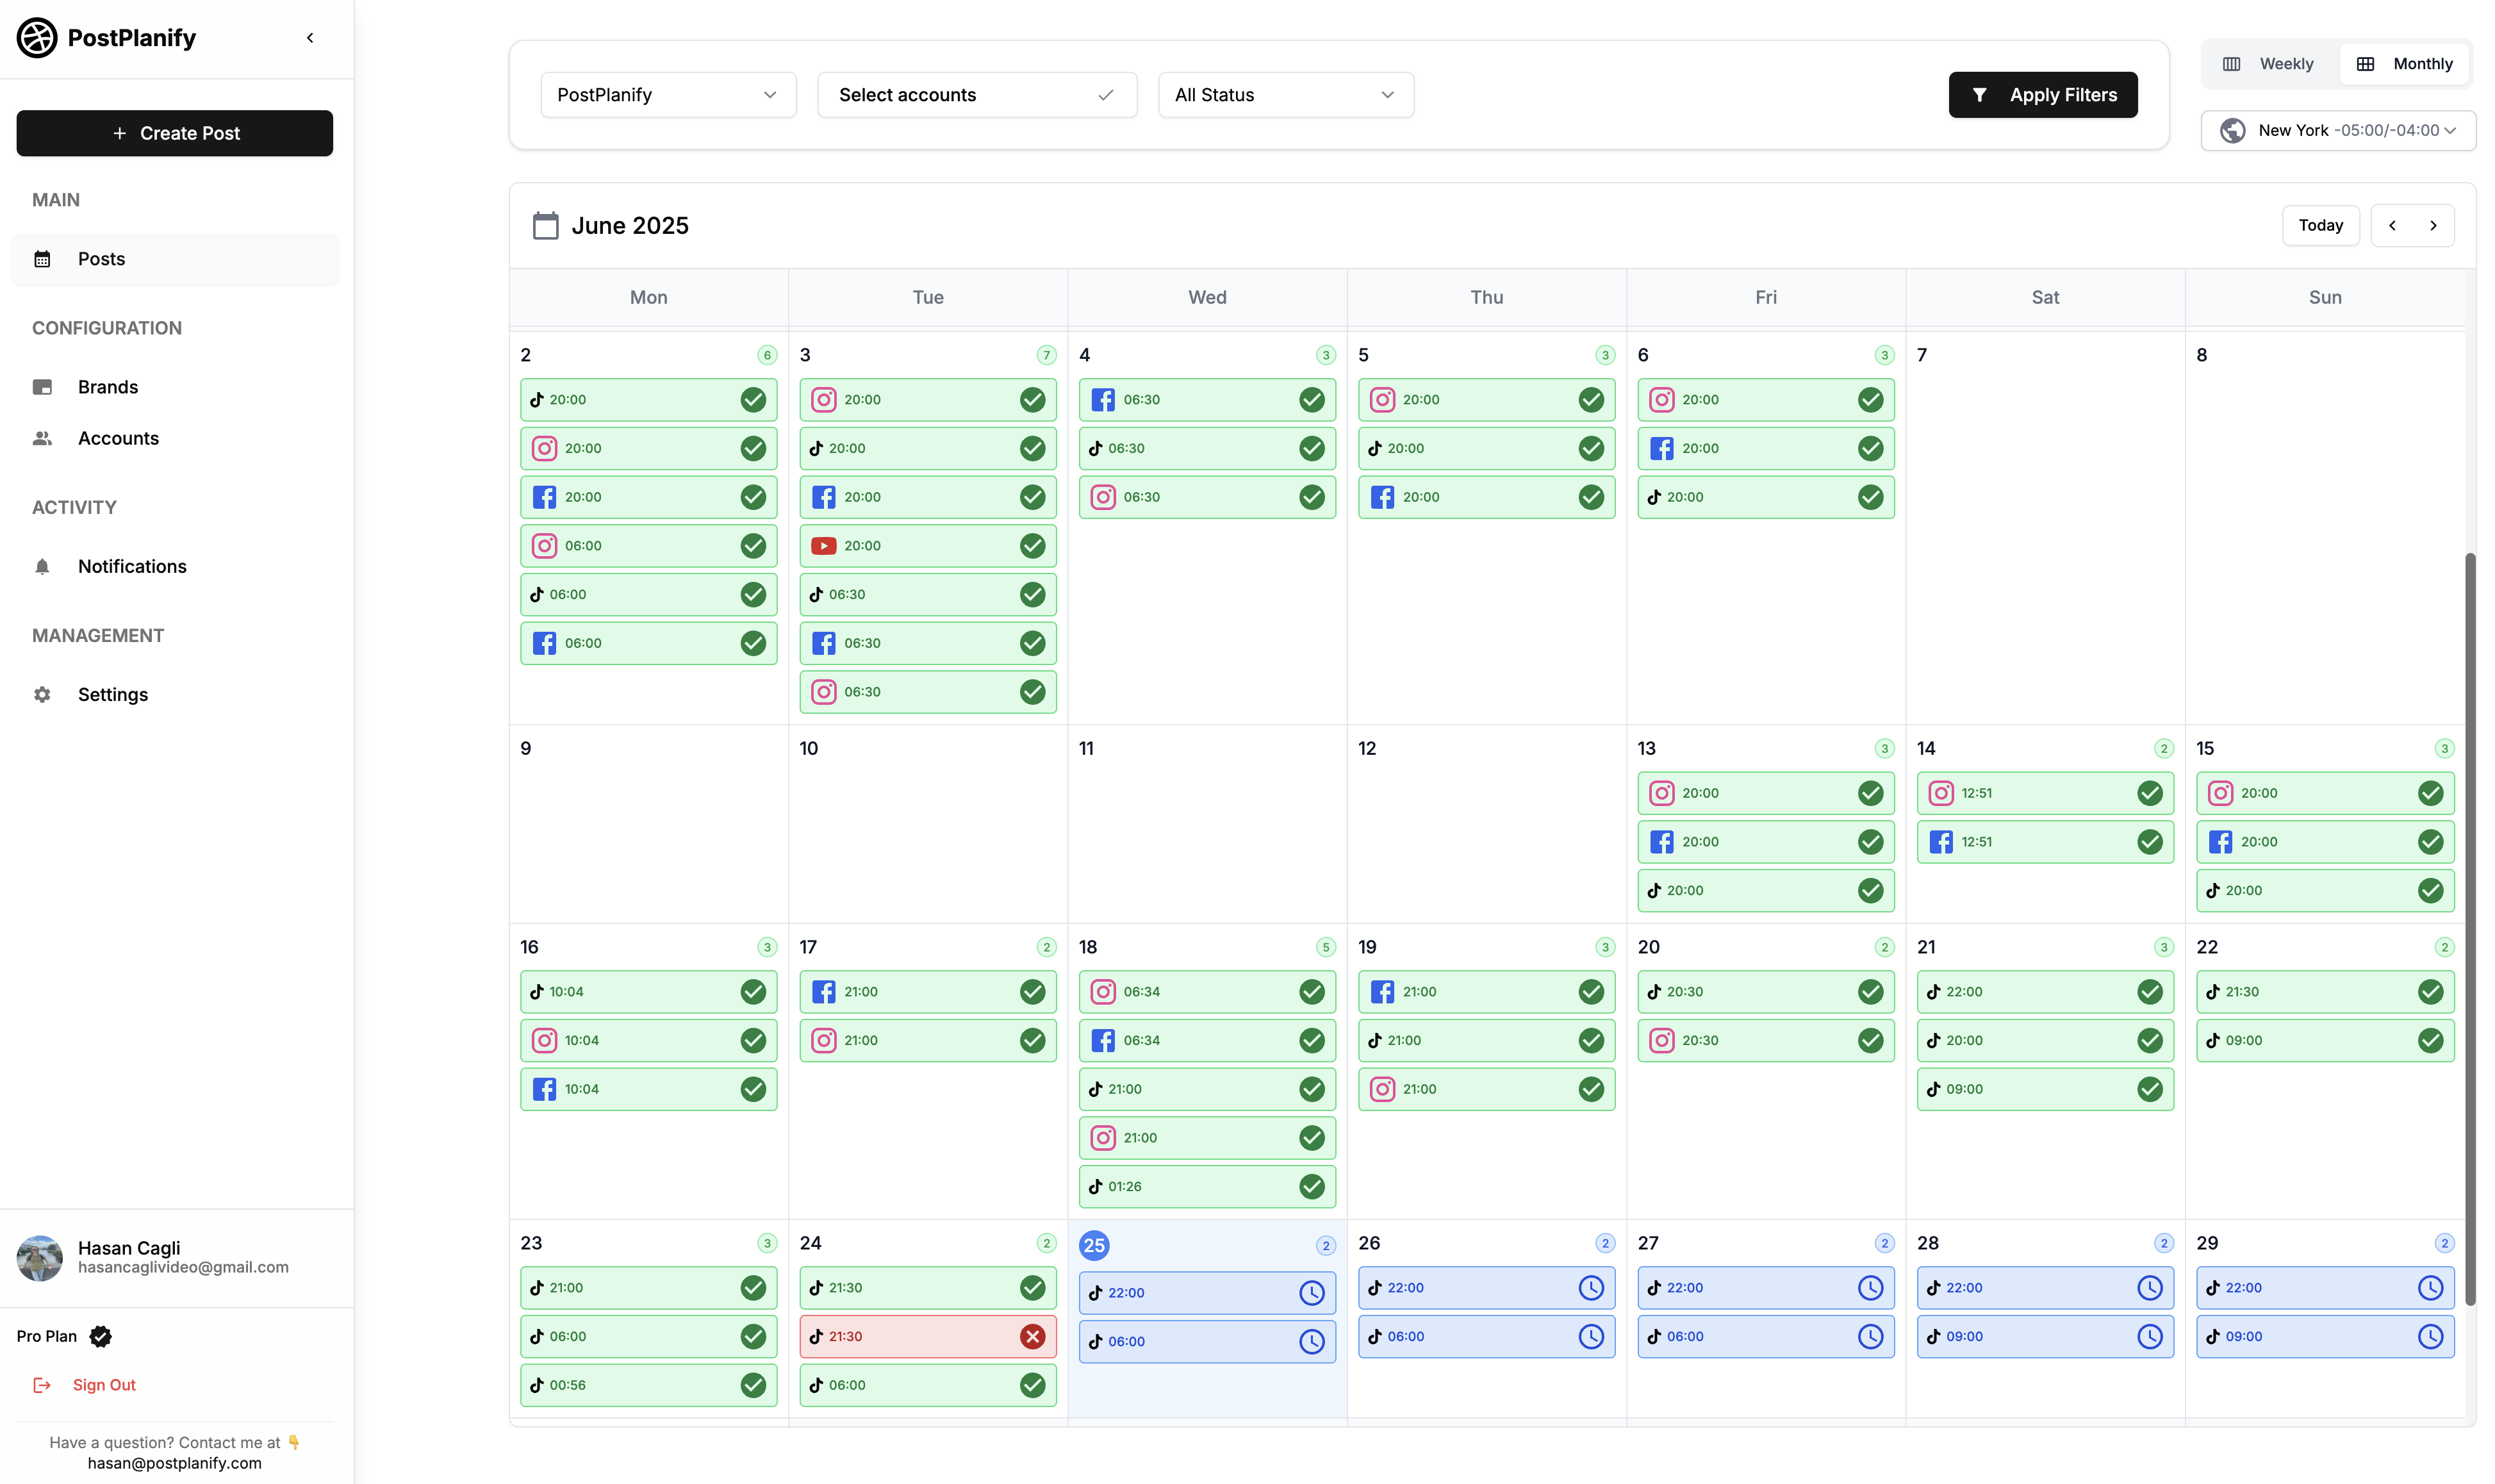
A content calendar like this gives you a bird’s-eye view of what was published, when, and on which platforms — making it easy to cross-reference your posting activity with the performance data in your report.
Add Context and Visualize Your Data
Numbers are just numbers until you give them meaning. A 15% increase in engagement sounds good, but it’s far more powerful when you explain what drove it. Always add that "so what?" analysis.
Don’t just present the numbers; tell the story behind them. For example: "Our engagement rate on Instagram jumped by 15% this month. This was driven by our new Reels series on customer testimonials, which tells us our audience is hungry for more user-generated content."
This is where visuals become your best friend. Use charts and graphs to make dense data easy to scan.
- Bar charts are perfect for comparing performance across platforms (e.g., clicks from Facebook vs. LinkedIn).
- Line graphs are great for showing trends over time, like follower growth or monthly website referrals.
- Pie charts work well for breaking down audience demographics or engagement types (likes vs. comments vs. shares).
For agencies, presenting this data professionally is critical. Tools with white-label reporting features, like those in PostPlanify, can automate chart creation and allow you to add your own branding. This saves a ton of time while ensuring your reports look polished, reinforcing the value you provide every single month.
Related: How to Plan Social Media Content | Social Media Content Calendar Examples | Social Media Strategy Examples
All your social media in one simple dashboard
Schedule posts, track analytics, and reply to comments/DMs — without switching tabs.
Engagement
+18%
Views
52.8k
From Data Points to Actionable Insights
Here's a walkthrough of how to turn raw social media data into insights that actually drive strategy:
A report stuffed with charts and numbers is a starting point, not the finish line. The real value is created when you turn that raw data into a strategic roadmap. This is where you move from reporting what happened to explaining why it happened—and that's the analysis that guides better decisions.
Think of yourself as a data detective. "Our engagement rate was 3%" is just a clue. Your job is to uncover the story behind it. Was it a new content format that resonated? A different posting time that hit the audience's sweet spot? Or was it an external factor, like a competitor's huge launch or an algorithm update?
Digging Deeper Than Surface-Level Metrics
Going beyond the basics means connecting the dots. A spike in reach is just a number until you tie it to the exact post that caused it. A dip in website clicks needs to be analyzed alongside the specific calls-to-action you used that week.
To get to the bottom of it, start asking the right questions about your performance data:
- Content Pillars: Which of our main themes—like educational tutorials, behind-the-scenes glimpses, or customer stories—are getting the most shares and saves?
- Format Performance: Are Reels outperforming static images for engagement on Instagram? Are simple text posts on LinkedIn sparking more conversations than posts with graphics?
- Audience Behavior: What’s the sentiment in the comments? Are people asking purchase-intent questions, leaving positive reviews, or do they seem confused?
- Timing and Frequency: Did posting an extra time on Tuesday boost our overall reach, or did it just dilute the engagement on each individual post?
Answering these questions transforms your report from a passive summary into an active, strategic tool. You’re no longer just reporting the news; you're helping to make it.
Pinpointing What Truly Resonates With Your Audience
Your audience leaves clues every day about what they want to see. The "Top Performing Content" section of your report is your treasure map. Don't just list the posts with the most likes; analyze them for common threads.
Look for patterns in your best content:
- Emotional Triggers: Did your top posts use humor, inspiration, or a sense of urgency to get a reaction?
- Visual Style: Is there a consistent look? Maybe it's high-contrast images or fast-paced video editing that's catching their eye.
- Copywriting: Was the caption a short, punchy question or a longer, more detailed story?
The goal is to develop a hypothesis you can actually test. For example: "Our three best posts this month were all short-form videos featuring a team member. This suggests our audience connects with human-centric content. Let's produce three more of these next month and see if we can replicate this success."
This approach turns analysis into a repeatable, data-backed process. You’re not just guessing what might work; you’re using real performance to build your strategy. To do this right, you need a solid grasp of your numbers; our guide on how to calculate your social media engagement rate will give you a strong foundation.
Leveraging AI for Smarter and Faster Insights
Manually sifting through months of posts to spot these trends is a massive time sink. This is where AI becomes a powerful ally. Automated social media analytics isn't a futuristic concept—it's here, and it's powering the next generation of reporting.
The market for these tools is projected to rocket from $31.07 billion in 2024 to an incredible $168.64 billion by 2035. This explosive growth shows just how critical intelligent analytics have become. You can read the full research on the social media management market to see how fast this space is moving.
Tools like PostPlanify can use AI to do this heavy lifting for you. Instead of you manually comparing dozens of posts in a spreadsheet, its analytics can automatically surface performance trends, pinpoint your best-performing content pillars, and even help draft analytical summaries. This can turn hours of grunt work into just a few minutes of strategic review.
Crafting Concrete, Data-Backed Recommendations
The final and most important piece is turning your insights into clear, actionable recommendations. This is what your clients or stakeholders really care about. They want to know what to do next.
Your recommendations must be direct and specific. Ditch vague statements like "we should post more videos." Instead, provide direction that’s backed by data:
-
Bad: "Post more video content."
-
Good: "Short-form video content posted on Tuesdays and Thursdays generates 35% more engagement than on other days. We recommend dedicating these two days to our primary video pushes."
-
Bad: "The new ad isn't working."
-
Good: "The new ad creative is underperforming with a 0.5% CTR, compared to our campaign average of 2.1%. We recommend pausing it and testing a new headline focused on the 'cost-saving' angle, which we saw resonate in our organic content."
This level of detail proves you’ve done your homework. It shows confidence and turns your report from a simple summary into an indispensable strategic document that proves your value.
Related: How to Create Engaging Social Media Content | Social Media Engagement Rate Calculator Guide | Content Repurposing Strategies
All your social media in one simple dashboard
Schedule posts, track analytics, and reply to comments/DMs — without switching tabs.
Engagement
+18%
Views
52.8k
Social Media Reporting FAQ
Even with a perfect plan, questions will come up when it's time to build a social media report. Every social media manager runs into the same challenges—from figuring out how often to report to navigating the conversation about a bad month. Here are direct answers to the most common questions.
How often should I create a social media report?
The right frequency depends on who's reading the report and what decisions they need to make.
- Weekly Reports: Best for internal teams. These quick check-ins are for making small, agile adjustments, like tweaking ad spend or shifting content based on a short-term trend. They are too frequent for showing meaningful strategic progress.
- Monthly Reports: The gold standard for most clients and executives. A month provides enough data to see real patterns emerge without getting lost in daily fluctuations. This is the ideal timeline to show progress against KPIs and discuss larger strategic shifts.
- Quarterly & Annual Reports: For high-level planning, budget reviews, and year-over-year growth analysis. These reports focus less on day-to-day tactics and more on demonstrating long-term business impact and ROI.
Key takeaway: Consistency is crucial. Pick a schedule and stick to it. Reporting on the same cadence is the only way to effectively benchmark performance and show true growth over time.
What are the most important metrics to include?
Your report should always be anchored to your specific goals, but a few foundational metrics are non-negotiable for any good report.
Always track these essentials:
- Reach & Impressions: How many people are you getting in front of? This is the top of your funnel.
- Engagement Rate: The pulse of your community. This shows how many people are interacting with your content and tells you what’s resonating.
- Follower Growth: A clear sign your content is valuable enough to attract new people to your brand.
- Website Clicks or Conversions: The bottom-line metric that ties social efforts directly to business results (leads, sales, sign-ups). This is how you prove ROI.
Never just list a number. Always add the "so what?" context. Don't just state the metric; explain what it means for the business and how it informs your strategy for the next period.
How should I report on a bad month or negative results?
It happens to everyone. The temptation to bury bad news is real, but it's the fastest way to lose trust. The best approach is to tackle it head-on with transparency and a clear plan. This is an opportunity to show you're a strategic expert, not just a content publisher.
Follow this three-step process:
- Present the Data Honestly: Show the dip in performance clearly. Don't sugarcoat it or try to spin the numbers. Transparency builds trust.
- Provide a Clear Analysis: Explain why the numbers are down. Was there a major algorithm change on Instagram? Did a competitor's campaign go viral? Was it a seasonal dip you anticipated? Your analysis proves you're on top of the situation.
- Offer a Data-Backed Action Plan: This is the most critical step. Come to the table with a specific strategy for turning things around. For example: "Our reach dropped 20% due to a suspected algorithm shift away from photo carousels. Our plan for next month is to reallocate 30% of our content production to short-form Reels, which are currently showing higher reach." This turns a negative into a moment of strategic leadership.
Can I make a good report without expensive tools?
Yes, but you will pay for it with your time. You can absolutely build a report by manually exporting data from each platform's native analytics and combining it in a spreadsheet.
The Problem: This manual process is incredibly time-consuming, repetitive, and prone to human error. It's a grind that takes you away from high-value strategic work.
This is where a social media management tool becomes a game-changer. A platform like PostPlanify automates all of that tedious data collection, pulling your key metrics into one clean dashboard. It saves hours of work and unlocks deeper insights, like cross-platform comparisons and automated trend-spotting, that are nearly impossible to do manually. For anyone serious about proving social media ROI, a good tool pays for itself almost immediately in time saved and insights gained.
What should a social media report include for clients?
A client-facing report needs to be more polished and results-focused than an internal one. At minimum, include: an executive summary with key wins, performance against the KPIs you agreed on, top-performing content with analysis of why it worked, audience growth trends, and a clear action plan for next month. Skip the raw data dumps — clients want to see the impact of your work, not a spreadsheet. If you manage multiple clients, white-label reports let you brand each report without building them from scratch.
How do I track social media performance across multiple platforms?
You have two options. The manual route: log into each platform's native analytics (Meta Business Suite, TikTok Analytics, LinkedIn Analytics, X Analytics), export the data, and combine everything in a spreadsheet. This works but is time-consuming and error-prone. The faster route: use a centralized tool like PostPlanify that pulls data from all your connected accounts into one dashboard. This lets you compare cross-platform performance instantly and build reports without the manual export-and-merge process.
What's the difference between reach and impressions in a social media report?
Reach is the number of unique people who saw your content. Impressions is the total number of times your content was displayed, including repeat views by the same person. If one person sees your post three times, that's 1 reach and 3 impressions. In your report, reach tells you how wide your content spread, while impressions indicate how often your audience was exposed to it. For a deeper breakdown, see our guide on social media impressions.
How long should a social media report be?
There's no magic number, but aim for clarity over length. A monthly report for a single brand typically runs 3-5 pages. A quarterly or multi-platform report might be 8-12 pages. The executive summary should be half a page maximum. If your report is longer than it needs to be, you're probably including data that doesn't connect to a goal. Every section should answer "so what?" — if it doesn't, cut it.
Should I include competitor analysis in my social media report?
Yes, if it adds strategic value. Comparing your engagement rate, posting frequency, or follower growth against 2-3 direct competitors gives your results context. A 3% engagement rate might look average on its own, but if your competitors average 1.5%, it's a strong result. Keep competitor sections brief — a simple comparison table is usually enough. Don't let competitor data dominate the report; it should support your narrative, not replace it.
Summary Checklist for Creating Your Report
- [ ] Define Your Goals: Start with SMART goals tied to business objectives (e.g., leads, traffic, sales).
- [ ] Select Your KPIs: Choose metrics that directly measure your goals (e.g., CTR, CPL, ROAS).
- [ ] Collect Your Data: Pull numbers from native analytics or use a centralized tool to save time.
- [ ] Start with an Executive Summary: Give the bottom-line results and key takeaways upfront.
- [ ] Structure the Body: Break down performance by KPI, platform, and top content.
- [ ] Visualize Your Data: Use charts and graphs to make numbers easy to understand.
- [ ] Add Analysis & Insights: Explain the "why" behind the numbers. What worked? What didn't?
- [ ] Provide Actionable Recommendations: End with a clear, data-backed plan for what to do next.
Ready to stop wasting hours on manual reporting and start creating strategic reports that prove your value? With PostPlanify, you can automate data collection, build custom white-label reports, and uncover actionable insights in minutes. Start your free 7-day trial today and see the difference.
Also read: Best Social Media Analytics Tools | How to Measure Social Media ROI | Social Media Best Practices | How to Create a Social Media Content Calendar | Best Social Media Management Platform | Save Time on Social Media Management
All your social media in one simple dashboard
Schedule posts, track analytics, and reply to comments/DMs — without switching tabs.
Engagement
+18%
Views
52.8k
About the Author

Hasan Cagli
Founder of PostPlanify, a content and social media scheduling platform. He focuses on building systems that help businesses, agencies, and teams plan, publish, and manage content and social media more efficiently across platforms.


