
In 2025, US social commerce sales hit $87.02 billion (eMarketer, December 9, 2025) — and will surpass $100 billion in 2026 for the first time.
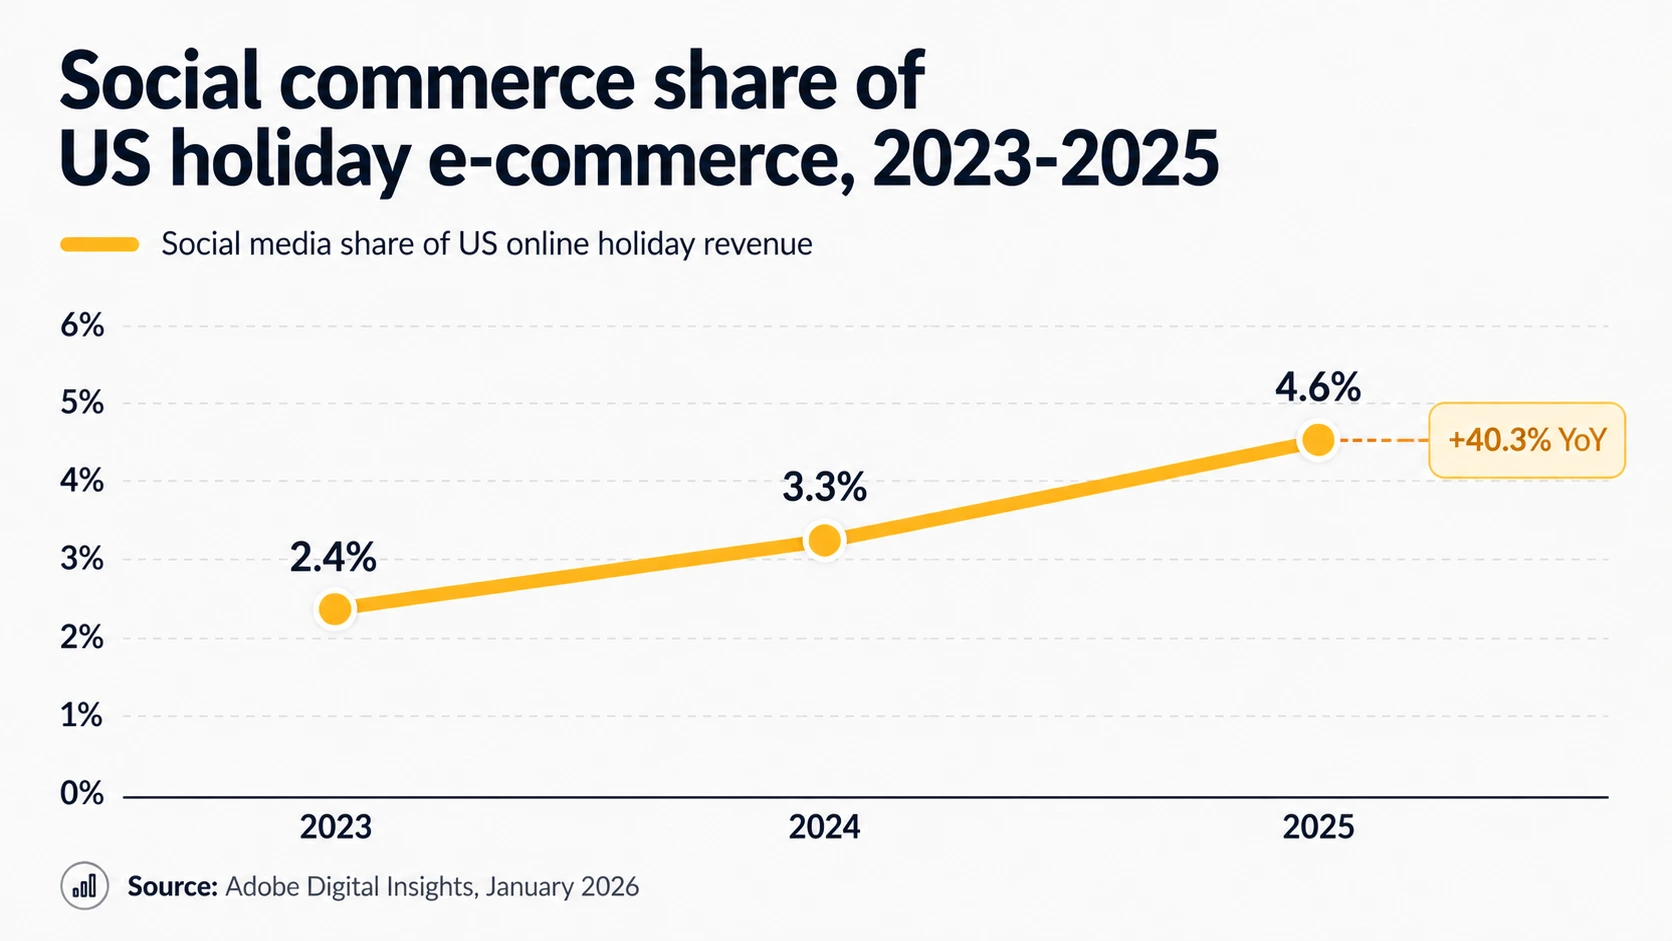
But that's one number from one firm. Sprout Social's 2025 Index reports that 81% of consumers make spontaneous purchases inspired by social content while only 13% buy directly inside a social platform. Adobe's holiday-season tracking puts social media's share of US online revenue at just 4.6%. Mordor Intelligence puts the global market above $2 trillion. eMarketer's US figure implies social commerce is barely 6.9% of US e-commerce.
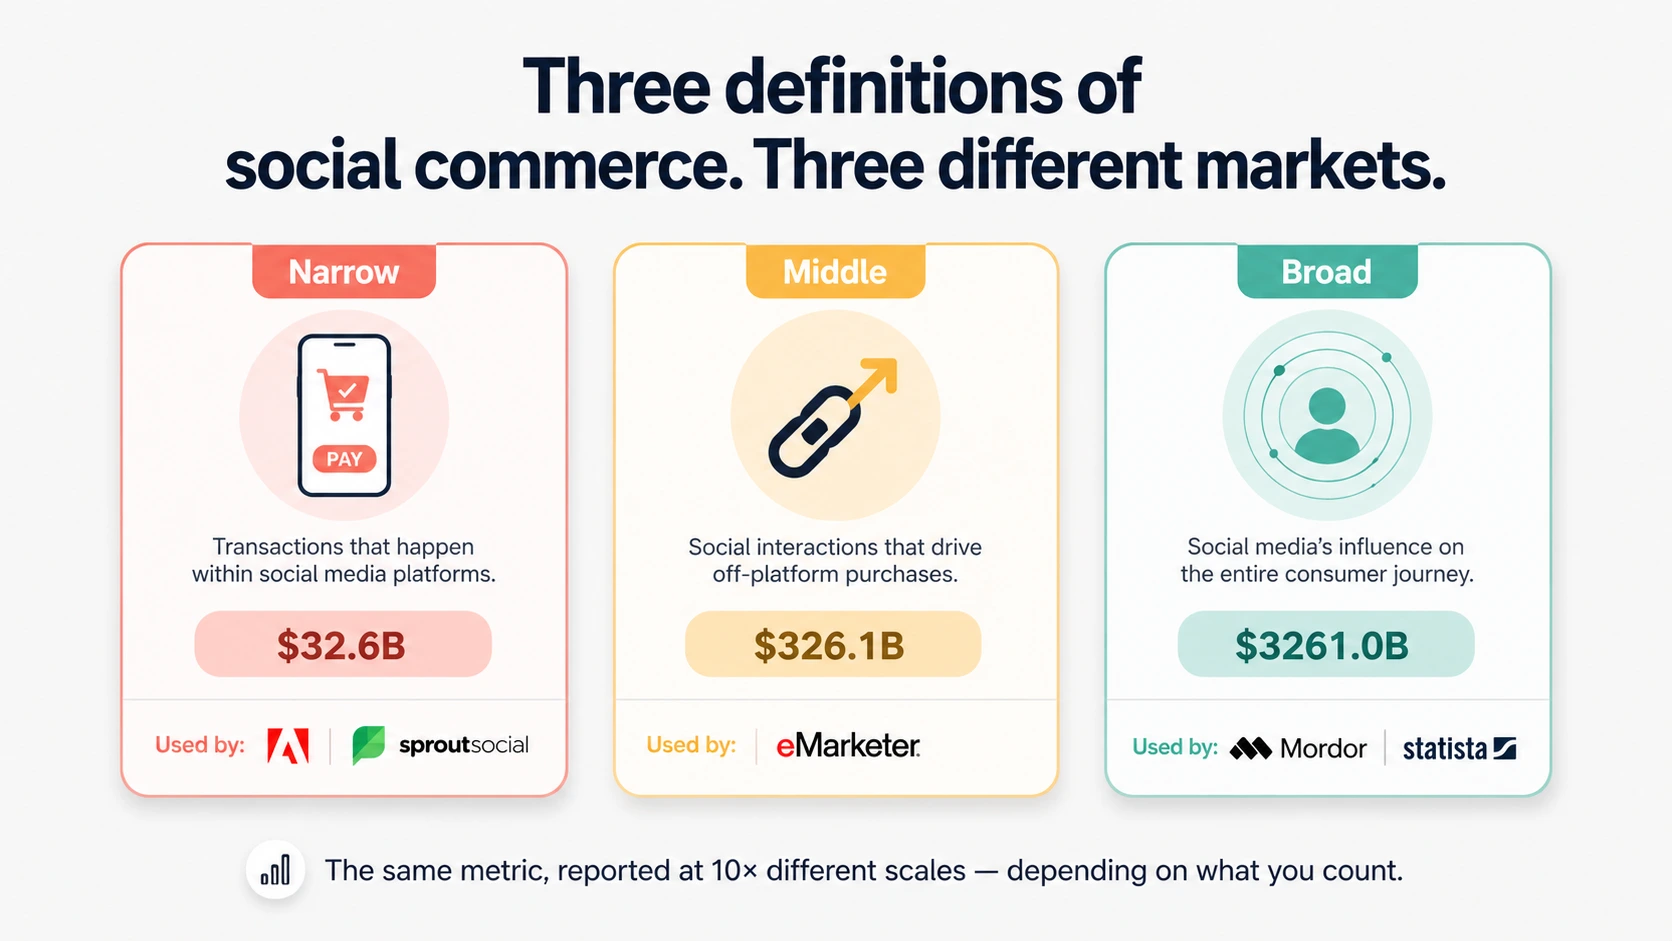
These aren't contradictions. They're three different definitions of "social commerce" — narrow (in-app checkout only), middle (purchases via social-platform-initiated links), and broad (any purchase a consumer attributes to social influence). Most stats articles paper over this. We're not.
This is a fully sourced reference article built from primary research releases published between September 2025 and April 2026 — eMarketer, TikTok Newsroom, Meta earnings, Pinterest earnings, Bain & Company's e-Conomy SEA 2025, Pew Research Center, Adobe Digital Insights, IAB, Sprout Social, Bazaarvoice, and Momentum Works. Every figure is cited inline. Stats we couldn't verify to a primary source are not in this article.
You'll get:
- Market size for the US, Southeast Asia, and globally — with the source-by-source variance disclosed
- TikTok Shop broken out by GMV, brand growth, creator earnings, and BFCM live data
- Pinterest, Meta, and other platform revenue and engagement figures from latest earnings
- Buyer demographics by age cohort, race, and platform — straight from Pew
- Live commerce verified data (mostly Asia-led) and the Western adoption gap
- Creator-driven commerce revenue and trust dynamics
- Brand ad spend and how social commerce sits inside the broader $121B social ad market
- Adoption barriers — including the trust gap that's keeping in-app checkout below 13%
Let's start with what nobody else explains: why the numbers don't match.
TL;DR — Social Commerce in 2026, At a Glance
- US social commerce will surpass $100 billion in 2026, up 18% from $87.02B in 2025 (eMarketer, December 2025).
- TikTok Shop now commands 18.2% of US social commerce, projected to hit 24.1% by 2027 (eMarketer).
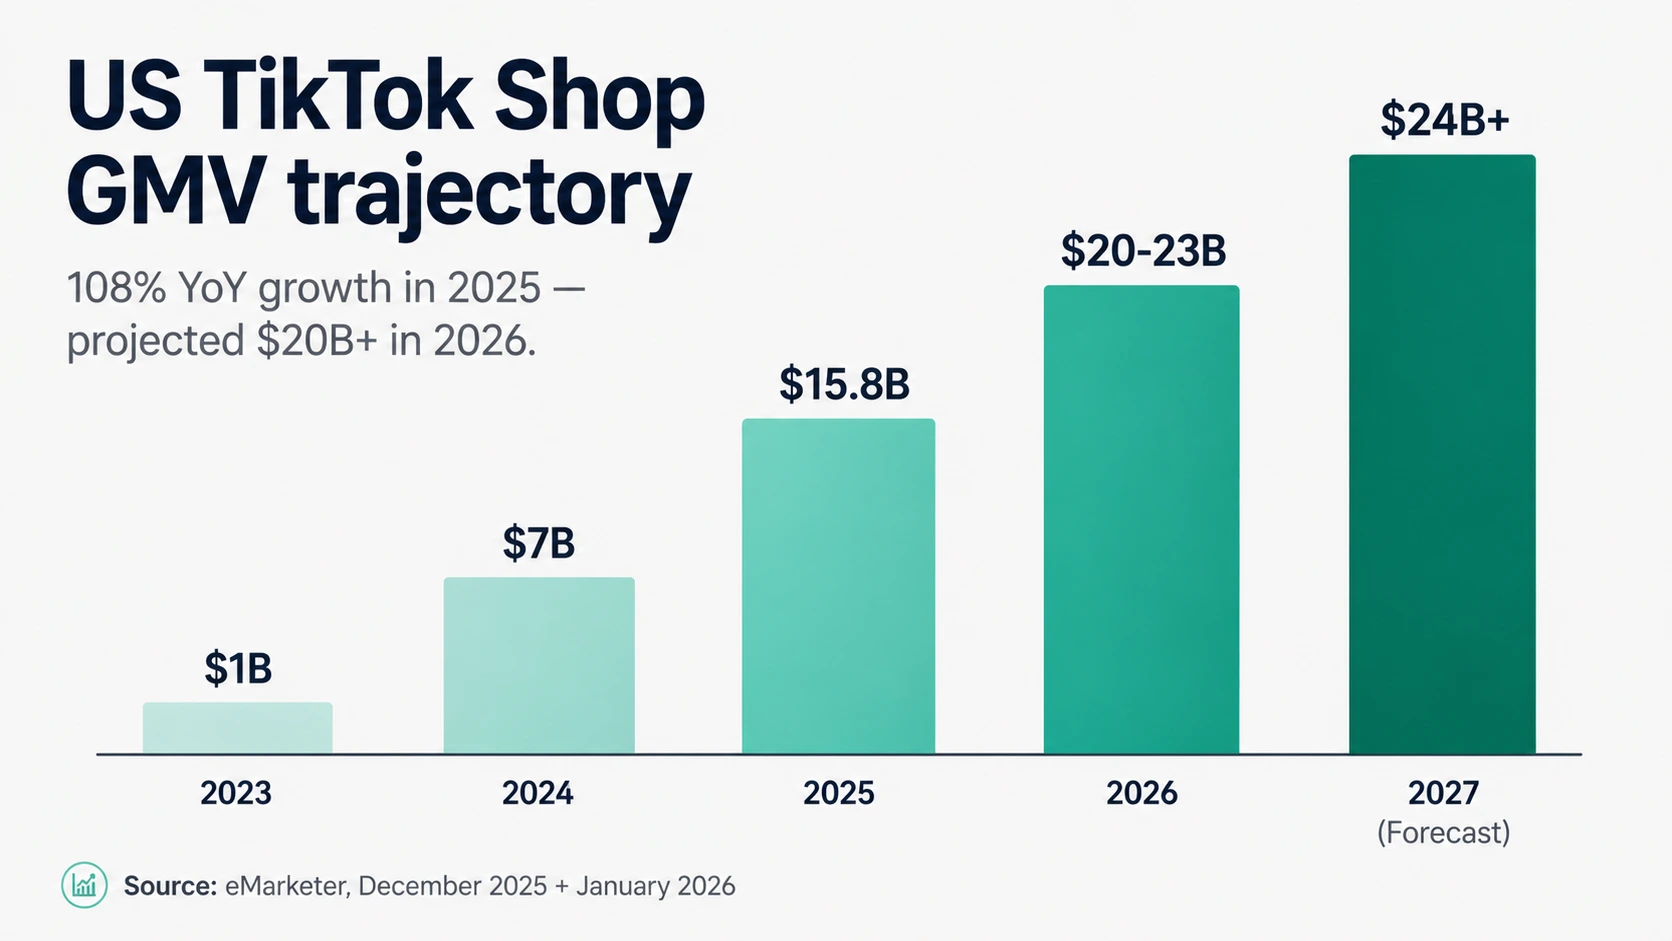
- TikTok Shop US grew 108% in 2025 to reach $15.82B in sales (eMarketer).
- TikTok Shop's global GMV reached $64.3B in 2025, up 94% year-over-year across 16 markets (Momentum Works, February 2026).
- 108.3 million Americans now buy through social media — 47.9% of all US social network users (eMarketer).
- Over half (51%) of US social buyers will shop on TikTok in 2026 (eMarketer FAQ, January 2026).
- 79% of Gen Z and Millennials integrate social media into their shopping journey (Bazaarvoice Shopper Preference Report 2025).
- Only 12% of consumers have ever participated in a livestream shopping event in Western markets (Bazaarvoice 2025).
- US social network ad spend will exceed $121 billion in 2026, ~32% of all US digital ad spending (eMarketer H2 2025 forecast).
- TikTok Shop creator earners grew 146% YoY, with 16,000+ creators generating six-figure sales (Modern Retail, March 2026).
Why Social Commerce Numbers Don't Match Across Reports
Before any specific number, the methodology problem. The same metric — "global social commerce market in 2025" — has been reported as $821B (Sprout/Statista), $1.1 trillion (Statista/eMarketer composite), and $2+ trillion (Mordor Intelligence). These aren't errors. They're different definitions:
| Definition | What's counted | Used by | 2025 figure scale |
|---|---|---|---|
| Narrow (in-app) | Only purchases completed entirely inside a social platform's checkout | Sprout Social ("13% buy directly"), Adobe Digital Insights | Smallest |
| Middle (social-initiated) | Purchases made via a link initiated on social, regardless of where checkout completes | eMarketer / Insider Intelligence | Mid-range — US $87B in 2025 |
| Broad (social-influenced) | Any purchase a consumer attributes to social media exposure | Mordor Intelligence, Statista, ResearchAndMarkets | Largest — global $1T–$2T+ |
The practical effect: when an article says "social commerce is a $2 trillion market," it's using the broad definition. When the same article says "but only 13% of consumers buy directly on social," it's switching to the narrow definition mid-paragraph. Both can be true — they're measuring different things.
We use eMarketer's middle definition for US figures throughout this article and flag the broader/narrower definitions explicitly when relevant. If you're going to cite any number from this piece, cite the definition with it.
Social Commerce Market Size & Growth in 2026
United States
| Metric | Value | Source |
|---|---|---|
| US social commerce sales 2025 | $87.02B (+21.5% YoY) | eMarketer, Dec 2025 |
| US social commerce sales 2026 (forecast) | >$100B (+18.0% YoY) | eMarketer, Dec 2025 |
| US social commerce as % of US retail e-commerce (2025) | 6.9% | eMarketer, Dec 2025 |
| US social commerce as % of US retail e-commerce (2029 forecast) | 9.3% | eMarketer, Dec 2025 |
| US social buyers (2025) | 108.3M (47.9% of US social network users) | eMarketer, Dec 2025 |
| Over half (50%+) of US social buyers will shop on TikTok | In 2026 | eMarketer, Dec 2025 |
What this means: the US growth story is real (+21% in 2025, +18% in 2026) but social commerce is still under 7% of total US e-commerce. The headline-grabbing $100B milestone is significant, but anyone framing social commerce as "replacing" traditional e-commerce in the US is overstating the data.
Southeast Asia (the global benchmark)
Southeast Asia is years ahead of the US on social commerce penetration. The 2025 e-Conomy SEA report (a joint project of Google, Temasek, and Bain & Company) is the cleanest primary source.
| Metric | Value | Source |
|---|---|---|
| Southeast Asia digital economy GMV 2025 | $300B+ | e-Conomy SEA 2025 |
| SEA e-commerce GMV 2025 | $185B | e-Conomy SEA 2025 |
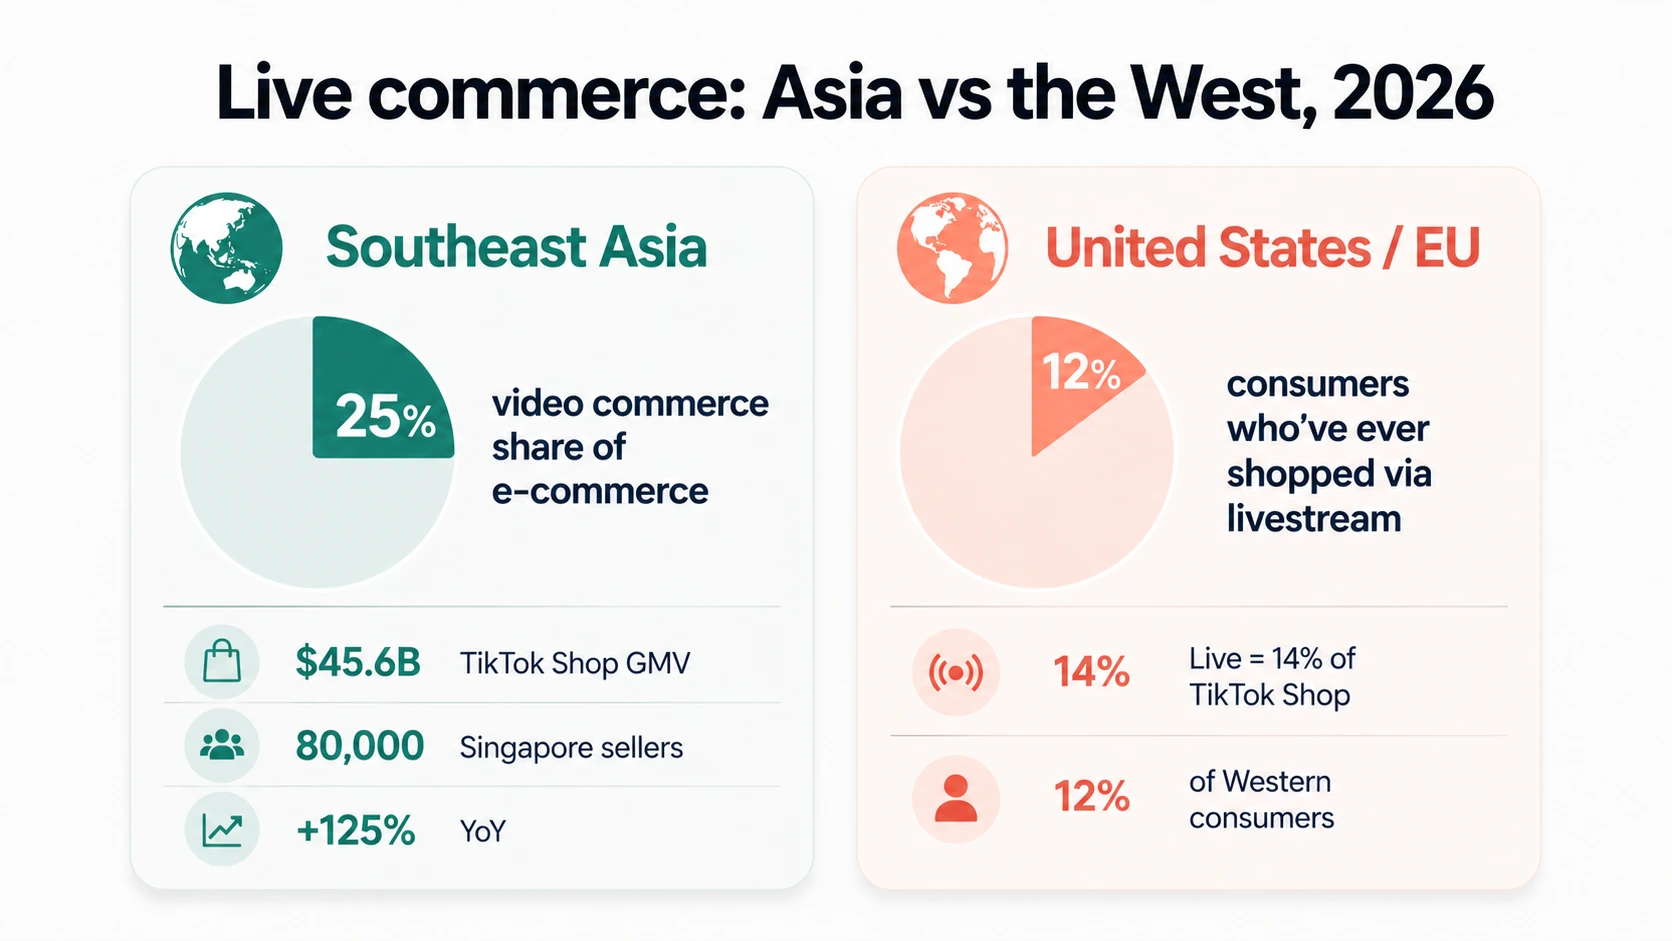
| Video commerce share of SEA e-commerce GMV | ~25% | e-Conomy SEA 2025 |
| Singapore video commerce sellers | 80,000 (+125% YoY) | e-Conomy SEA 2025 |
| Singapore video commerce transactions | 45M (+30% YoY) | e-Conomy SEA 2025 |
What this means: in Southeast Asia, video and live commerce already account for roughly a quarter of all e-commerce GMV. In the US, it's a low-single-digit percentage. The gap is the single biggest indicator of where Western social commerce is heading over the next 3–5 years.
All your social media in one simple dashboard
Schedule posts, track analytics, and reply to comments/DMs — without switching tabs.

Engagement
+18%
Views
52.8k
TikTok Shop: The Engine of US Social Commerce in 2026
TikTok Shop is the single largest driver of social commerce growth — both in absolute dollars and in share gains against incumbents.
US TikTok Shop GMV and growth
| Metric | Value | Source |
|---|---|---|
| US TikTok Shop GMV 2025 (eMarketer) | $15.82B (+108% YoY) | eMarketer, Dec 2025 |
| US TikTok Shop GMV 2025 (Momentum Works) | $15.1B (+68% YoY) | Momentum Works, Feb 2026 |
| Share of US social commerce 2025 | 18.2% | eMarketer, Dec 2025 |
| Share of US social commerce 2027 (forecast) | 24.1% | eMarketer, Dec 2025 |
| US TikTok Shop 2026 forecast (Dec 2025 estimate) | >$20B | eMarketer, Dec 2025 |
| US TikTok Shop 2026 forecast (Jan 2026 update) | $23.41B (+48% YoY) | eMarketer FAQ, Jan 2026 |
| US TikTok Shop 2028 forecast | >$30B | eMarketer, Dec 2025 |
| US TikTok buyers 2025 | 53.2M (+13.6% YoY) | eMarketer, Dec 2025 |
| US TikTok buyers 2026 | 57.7M (+8.6% YoY) | eMarketer, Dec 2025 |
⚠️ The $700M variance between eMarketer's $15.82B and Momentum Works' $15.1B comes from each firm counting a slightly different transaction set. Both are credible — cite them together when accuracy matters.
Global TikTok Shop scale
| Metric | Value | Source |
|---|---|---|
| Global TikTok Shop GMV 2025 | $64.3B (+94% YoY) | Momentum Works, Feb 2026 |
| Markets active globally | 16 | Momentum Works, Feb 2026 |
| Southeast Asia GMV 2025 | $45.6B (doubled YoY) | Momentum Works, Feb 2026 |
TikTok Shop sales mix and brand penetration
| Metric | Value | Source |
|---|---|---|
| US TikTok Shop sales by source: video | 50% | Momentum Works, Feb 2026 |
| US TikTok Shop sales by source: Shop tab | 36% | Momentum Works, Feb 2026 |
| US TikTok Shop sales by source: live commerce | 14% (up from 10% in 2024) | Momentum Works, Feb 2026 |
| US TikTok Shop stores exceeding $1M GMV in 2025 | 2,000+ | Momentum Works, Feb 2026 |
| Big-brand sales growth (>$10M revenue brands) in BFCM 2025 | +76% YoY | TikTok Newsroom, Dec 2025 |
| US searches with e-commerce intent in 2025 | 103B+ | Modern Retail, Mar 2026 |
TikTok Shop BFCM 2025 highlights (TikTok-disclosed)
| Metric | Value | Source |
|---|---|---|
| Total sales (4-day BFCM weekend) | $500M+ | TikTok Newsroom, Dec 2025 |
| Year-over-year shopper growth | +50% | TikTok Newsroom, Dec 2025 |
| Livestream sales growth | +84% YoY | TikTok Newsroom, Dec 2025 |
| Livestream sessions | 760,000+ | TikTok Newsroom, Dec 2025 |
| Livestream views | 1.6B+ | TikTok Newsroom, Dec 2025 |
| Shoppable videos posted by creators | ~10M | TikTok Newsroom, Dec 2025 |
Why this matters: TikTok Shop's growth is no longer creator-driven alone. The 76% YoY growth from brands with $10M+ in annual revenue means the channel is graduating into a serious enterprise distribution channel — which historically has been when share gains accelerate, not decelerate.
If you're scheduling content for TikTok Shop, our TikTok scheduler supports the post types most-tied to commerce performance (video + Shop tab placements).
Other Platforms: Pinterest, Meta, and YouTube in Social Commerce
Pinterest is the only public social platform whose entire business model is shopping intent. Their Q4 2025 earnings (Pinterest, February 12, 2026) make the case:
| Metric | Value | Source |
|---|---|---|
| Global monthly active users (Q4 2025) | 619M (+12% YoY) | Pinterest Q4 2025 release |
| Full-year 2025 revenue | $4.222B (+16% YoY) | Pinterest Q4 2025 release |
| Global ARPU (FY 2025) | $7.21 | Pinterest Q4 2025 release |
| Monthly searches | 80B+ | Pinterest Q4 2025 release |
What this means: Pinterest doesn't show up in the headlines like TikTok Shop, but 80 billion monthly searches with strong shopping intent makes it the most under-priced social commerce surface. Pinterest's ARPU is still under $8 — meaningful upside if shopping intent monetization improves. For brands, it's the most direct discovery-to-purchase platform in social. Our Pinterest scheduler handles Idea Pins and product-tagged Pins from one workflow.
Meta (Instagram + Facebook)
Meta does not break out Instagram Shopping or Facebook Shops revenue in earnings, so the available data is platform-wide. From Meta's Q4 2025 release (January 28, 2026):
| Metric | Value | Source |
|---|---|---|
| Family Daily Active People (Dec 2025) | 3.58B (+7% YoY) | Meta Q4 2025 |
| Q4 2025 revenue | $59.89B (+24% YoY) | Meta Q4 2025 |
| Full-year 2025 ad revenue | $196.175B (+22% YoY) | Meta Q4 2025 |
| Full-year 2025 ad impressions | +12% YoY | Meta Q4 2025 |
| Full-year 2025 average price per ad | +9% YoY | Meta Q4 2025 |
The transparency gap: Meta's refusal to disclose Instagram Shopping or Facebook Shops GMV separately is the single biggest blind spot in social commerce reporting. Every "Instagram Shopping market size" estimate is third-party modeling. Treat any specific Meta-platform shopping figure with skepticism unless it traces back to a primary disclosure (which there isn't one).
YouTube
YouTube does not publish Shopping GMV. Apart from Pinterest's earnings and the e-Conomy SEA video commerce data, public YouTube Shopping data for 2026 is currently thin. We've left YouTube out rather than cite figures we can't trace.
Who's Buying: Demographics & Behavior
The most rigorously methodological data on US platform usage comes from Pew Research Center's "Social Media Use in 2025", published November 20, 2025.
US adult platform usage (Pew, November 2025)
| Platform | All US adults | Age 18–29 | Hispanic adults |
|---|---|---|---|
| YouTube | 84% | 95% | 88% |
| 71% | 68% | 74% | |
| 50% | 80% | 62% | |
| TikTok | 32% | 63% | 57% (highest racial cohort) |
| 37% | — | — | |
| Snapchat | — | 58% | — |
| 25% | — | — | |
| X (Twitter) | 8% | — | — |
Buyer behavior
| Metric | Value | Source |
|---|---|---|
| US Gen Z (18–34) who've made a social purchase | ~33% | eMarketer FAQ, Jan 2026 |
| US 35–54 who've made a social purchase | 23% | eMarketer FAQ, Jan 2026 |
| US 55–65 who've made a social purchase | 13% | eMarketer FAQ, Jan 2026 |
| US Gen Z who say social is main source for product discovery | 73% | eMarketer FAQ, Jan 2026 |
| US 18+ who've purchased after an influencer endorsement | 58% | eMarketer FAQ, Jan 2026 |
| Gen Z + Millennials who integrate social into shopping journey | 79% | Bazaarvoice Shopper Preference Report 2025 |
| Gen Z + Millennials who've purchased based on creator recs | ~56% | Bazaarvoice Shopper Preference Report 2025 |
| US consumers using social for spontaneous purchases | 81% | 2025 Sprout Social Index |
| US consumers buying directly inside a social platform | 13% | 2025 Sprout Social Index |
The 81% vs 13% gap is the entire story of social commerce in 2026. Most buying decisions are influenced by social, but most checkout still happens off-platform. The brands and tools that close that gap — by making in-app checkout faster, cheaper, and more trusted — are the ones that win the next phase. For the brands not winning yet, see our guide on how to measure social media ROI.
India: a case study in creator-driven scale
| Metric | Value | Source |
|---|---|---|
| Gen Z share of India's e-retail shoppers | 40–45% | Bain & Company "How India Shops Online 2026" |
| Consumer spending influenced by Indian creators | $350B+ today | BCG / WAVES 2025, as published by PIB India |
| Projected by 2030 | $1T+ | BCG / WAVES 2025, via PIB India |
All your social media in one simple dashboard
Schedule posts, track analytics, and reply to comments/DMs — without switching tabs.
Engagement
+18%
Views
52.8k
Live Commerce: Why Asia Is Years Ahead of the West
Live commerce is the single biggest definitional split between Asian and Western social commerce. The verified data:
Asia (especially Southeast Asia)
| Metric | Value | Source |
|---|---|---|
| Video commerce share of SEA e-commerce GMV | ~25% | e-Conomy SEA 2025 |
| TikTok Shop SEA GMV 2025 | $45.6B (doubled YoY) | Momentum Works, Feb 2026 |
| Singapore video commerce sellers | 80,000 (+125% YoY) | e-Conomy SEA 2025 |
| TikTok Shop livestream share of US GMV | 14% (up from 10% in 2024) | Momentum Works, Feb 2026 |
| TikTok BFCM 2025 livestream sessions | 760,000+ | TikTok Newsroom, Dec 2025 |
| TikTok BFCM 2025 livestream views | 1.6B+ | TikTok Newsroom, Dec 2025 |
| TikTok BFCM 2025 livestream sales growth | +84% YoY | TikTok Newsroom, Dec 2025 |
Western markets
| Metric | Value | Source |
|---|---|---|
| US/EU consumers who've ever participated in livestream shopping | 12% | Bazaarvoice Shopper Preference Report, April 2025 |
The full picture: TikTok Shop's livestream BFCM data shows live commerce works in the US when the format and infrastructure are right. But broader-population adoption is still in the single digits. Live commerce in the West will likely follow the path of mobile commerce — slow for years, then sudden.
Creator-Driven & Influencer Commerce
Creator-driven commerce is the fastest-growing slice of social commerce. The verified figures:
| Metric | Value | Source |
|---|---|---|
| Global content creators (2025 estimate) | ~67M | Goldman Sachs Global Investment Research, March 2025 |
| Global creator growth rate (CAGR to 2030) | ~10% (reaching ~107M) | Goldman Sachs, Mar 2025 |
| US social media creator revenue 2026 forecast | $20.6B (+16.2% YoY) | eMarketer FAQ, Jan 2026 |
| TikTok Shop creator commission earners YoY growth | +146% | Modern Retail, Mar 2026 |
| TikTok Shop creators earning six figures+ in 2025 | 16,000+ | Modern Retail, Mar 2026 |
| TikTok Shop creators with $1M+ GMV (2025) | 1,785 (up from 529) | Momentum Works, Feb 2026 |
| Creator-led GMV processed by Later platform | $2.4B annualized | eMarketer FAQ, Jan 2026 |
| Shoppers who say short-form video is most influential format | 46% | Bazaarvoice Shopper Preference Report 2025 |
What this means: the creator economy isn't a fluffy category — it's converting into measurable GMV at scale. The 146% YoY jump in TikTok Shop creator earners is the single sharpest growth line in social commerce. Brands that aren't running structured creator partnership programs by H2 2026 are leaving the platform's biggest growth lever on the table.
For brands trying to scale creator content production, our AI assistant generates platform-native variations of a single post across all 10 supported platforms.
Brand & Advertiser Spend
How does social commerce sit inside the broader social ad market? The IAB's 2026 Outlook Study (January 28, 2026) is the cleanest forecast:
| Metric | Value | Source |
|---|---|---|
| US total ad spend growth 2026 forecast | +9.5% | IAB 2026 Outlook |
| Social media ad spend growth 2026 | +14.6% | IAB 2026 Outlook |
| Commerce media ad spend growth 2026 | +12.1% | IAB 2026 Outlook |
| Connected TV ad spend growth 2026 | +13.8% | IAB 2026 Outlook |
| US social network ad spending 2026 (eMarketer forecast) | >$121B | eMarketer Social Network Ad Spending H2 2025 |
| Social ad spend as % of US digital ad spend | ~32% | eMarketer, H2 2025 |
| US ad spend growth 2025 (excl. political) | +11% | eMarketer, December 2025 |
| US ad spend growth 2026 (excl. political) | +6.6% | eMarketer, Dec 2025 |
| US ad spend growth 2026 (incl. political) | +8.9% | eMarketer, Dec 2025 |
| Global e-commerce 2026 forecast | >$6.8T | Sprout Social citing eMarketer, April 2026 |
What this means for brands: US social network ad spending alone is roughly $121B vs. social commerce sales of $100B in 2026. Brands are still spending more on advertising on social platforms than the total revenue generated through them. That gap closes substantially as in-app shopping matures — which is the next 24-month story.
For agencies measuring cross-platform spend efficiency, our analytics covers all 10 supported platforms in one dashboard.
Holiday Shopping & Adobe Digital Insights Data
Adobe's holiday tracking is the most rigorous narrow-definition social commerce data source for the US. From the January 7, 2026 Adobe release:
| Metric | Value | Source |
|---|---|---|
| US online holiday spend 2025 | $257.8B (+6.8% YoY) | Adobe, Jan 2026 |
| Mobile share of online holiday spend | 56.4% | Adobe, Jan 2026 |
| Social media share of online holiday revenue | 4.6% (+40.3% YoY from 3.3%) | Adobe, Jan 2026 |
| Social media share of Cyber Monday revenue | 3.6% (+56.5% YoY) | Adobe Cyber Monday release, Dec 2025 |
| Holiday BNPL spending | $20B (+9.8% YoY) | Adobe, Jan 2026 |
| Cyber Monday BNPL spending | $1.03B (+4.2% YoY) | Adobe, Jan 2026 |
| GenAI-driven traffic to retail sites (full holiday) | +693.4% YoY | Adobe, Jan 2026 |
| GenAI-driven traffic on Cyber Monday | +670% YoY | Adobe, Jan 2026 |
Why this matters: Adobe's social commerce share (4.6%) is the strictest, narrowest figure — and it's growing fastest of any channel they track (+40% YoY). Whatever definition you use, the growth direction is the same: up sharply. The GenAI traffic surge (+693% YoY) is the most underreported holiday-season retail story of 2025-2026.
All your social media in one simple dashboard
Schedule posts, track analytics, and reply to comments/DMs — without switching tabs.
Engagement
+18%
Views
52.8k
Cart Abandonment, ROI, and Trust Barriers
Cart abandonment
| Metric | Value | Source |
|---|---|---|
| Overall e-commerce cart abandonment rate | 70.22% | Baymard Institute, September 2025 |
Note: the widely-cited "91% social cart abandonment" figure cannot be traced to a primary source — it does not appear in Baymard's data. We've omitted it.
Trust and adoption friction
| Metric | Value | Source |
|---|---|---|
| US consumers who don't trust influencer marketing | 26% (vs. 11% for advertising overall) | eMarketer FAQ, Jan 2026 |
| US consumers who distrust influencers who don't disclose brand relationships | 64% | eMarketer FAQ, Jan 2026 |
| Consumers who trust GenAI tools and shopping agents | 55% (75% of 18–34) | Bazaarvoice 2025 SEI |
Platform safety (TikTok Shop disclosed)
| Metric | Value | Source |
|---|---|---|
| Products proactively rejected (Jan–June 2025) | 40M+ | TikTok Newsroom, Dec 2025 |
| Products removed after listing | 2M+ | TikTok Newsroom, Dec 2025 |
Forrester's bottom line
Forrester's July 2025 analysis: more than one-third of US Gen Z and Millennial online adults report purchasing directly from a creator or influencer post — but Forrester concludes that in-platform purchasing has not yet hit critical mass in the US, with consumer trust and broader friction barriers remaining high.
Methodology & Sources
How this article was built
- Every statistic in this article was traced to a primary source — vendor reports, earnings releases, official press announcements, or government/research-institute publications. No blog-to-blog citations.
- For market-size figures with significant cross-source variance, we cite multiple sources side-by-side with each definition labeled.
- Stats we couldn't verify to a primary source (the widely-cited "91% social cart abandonment," 2021-vintage Snapchat AR figures, unverified China-specific Douyin GMV figures, and McKinsey live commerce conversion rates we couldn't fetch) were dropped entirely rather than included with weak attribution.
- Last updated: April 25, 2026. We update this page quarterly (January / April / July / October).
Primary sources cited
- eMarketer "TikTok Shop Makes Up Nearly 20% of Social Commerce in 2025" — December 9, 2025
- eMarketer "FAQ on Social Commerce" — January 20, 2026
- eMarketer US Social Network Ad Spending Forecast Report H2 2025
- eMarketer "US Ad Spending Grows 11%" — December 8, 2025
- Momentum Works "TikTok Shop in the U.S. 2025" — February 11, 2026
- TikTok Newsroom "Biggest BFCM Weekend Ever" — December 3, 2025
- Modern Retail TikTok Shop coverage — March 26, 2026
- Pinterest Q4 2025 Earnings Release — February 12, 2026
- Meta Q4 2025 Earnings Release — January 28, 2026
- Pew Research Center "Social Media Use in 2025" — November 20, 2025
- Adobe Holiday Shopping Season 2025 release — January 7, 2026
- Adobe Cyber Monday 2025 release — December 2, 2025
- IAB 2026 Outlook Study — January 28, 2026
- e-Conomy SEA 2025 (Bain / Google / Temasek) — November 11, 2025
- Bain "How India Shops Online 2026" — April 2026
- Bazaarvoice Shopper Experience Index 2025 — September 30, 2025
- Bazaarvoice Shopper Preference Report 2025 — April 2025
- Sprout Social 2026 Content Strategy Report
- Goldman Sachs Global Investment Research "Creator Economy" — March 26, 2025
- Forrester "Social Commerce Shows Promise" — July 14, 2025
- Baymard Institute Cart Abandonment Statistics — September 22, 2025
- PIB India press release on India Creator Economy — 2025
Methodology caveats worth flagging
- No standard definition of "social commerce." Sources range from narrow (in-app checkout only — Adobe, Sprout's "13%") to broad (any social-influenced purchase — Mordor, Statista). When a number sounds dramatic, check the definition.
- Meta, YouTube, and Snap do not separately disclose Shopping GMV. Any specific revenue figure attributed to Instagram Shopping, Facebook Shops, YouTube Shopping, or Snap commerce is third-party modeling unless explicitly stated otherwise in this article.
- eMarketer figures are forecasts, updated quarterly. The December 9, 2025 release said US TikTok Shop will surpass $20B in 2026; the January 20, 2026 FAQ updated this to $23.41B (+48%). Both are eMarketer; the more recent number reflects updated assumptions.
- The "91% social cart abandonment" figure circulating widely is not in Baymard. It does not have a verifiable primary source. Do not cite it.
- China-specific live commerce GMV figures (Douyin H1 2025, Kuaishou full-year, etc.) are abundant in industry coverage but rarely traceable to primary Chinese-language sources we could fetch. We've left them out.
- Single-vendor concentration: roughly 30 of the figures in this article come from eMarketer (Insider Intelligence) reports. eMarketer is a Tier 1 forecast source, but when they update assumptions (as happened between the December 2025 and January 2026 TikTok Shop forecasts), several figures here can shift simultaneously. Treat eMarketer numbers as point-in-time estimates that we refresh quarterly.
FAQ: Social Commerce Statistics 2026
What is social commerce?
Social commerce is the use of social media platforms to drive product discovery and purchases. Definitions vary by source — some count only in-app checkout (the "narrow" definition, used by Adobe and reflected in Sprout Social's "only 13% buy directly" stat); others count purchases via any social-platform-initiated link regardless of where checkout completes (the "middle" definition, used by eMarketer); others count any purchase a consumer attributes to social influence (the "broad" definition, used by Mordor Intelligence and Statista). The same metric reported under different definitions can differ by 10× or more.
How big is the social commerce market in 2026?
US social commerce sales will surpass $100 billion in 2026, up 18% from $87.02B in 2025 (eMarketer, December 2025). Globally, estimates range from approximately $1.1 trillion (Statista/eMarketer, narrow-to-middle definition) to over $2 trillion (Mordor Intelligence, broad definition). The variance comes entirely from definitional differences — see the methodology section above.
Which platform leads social commerce in 2026?
TikTok Shop is the leading social commerce platform in the US, with 18.2% of US social commerce share in 2025 — projected to reach 24.1% by 2027 (eMarketer). Globally, TikTok Shop's GMV reached $64.3B in 2025, up 94% YoY (Momentum Works). Pinterest leads on user shopping intent (619M MAU and 80B+ monthly searches per Pinterest Q4 2025 earnings), but its share of dollar GMV is much smaller than TikTok Shop's.
How fast is TikTok Shop growing in 2026?
In the US, TikTok Shop GMV grew 108% in 2025 to $15.82B (eMarketer). The 2026 forecast is over $20B (December 2025 estimate) or $23.41B / +48% YoY (January 2026 update). Big-brand sales (brands with $10M+ in revenue) grew 76% YoY during BFCM 2025 alone (TikTok Newsroom). Globally, TikTok Shop is operational in 16 markets with combined GMV of $64.3B in 2025.
How many Americans shop on social media?
108.3 million Americans shopped through social media in 2025 — that's 47.9% of US social network users (eMarketer). Over half (51%) of US social buyers will shop on TikTok specifically in 2026, making TikTok the dominant channel within the broader social commerce category.
What percentage of Gen Z buys through social media?
About one-third of US adults aged 18–34 have made a purchase on social media (eMarketer). 73% of US Gen Z say social media is their main source for learning about new products. Roughly 56% of Gen Z and Millennials report purchasing based on creator recommendations (Bazaarvoice 2025). And 79% of Gen Z and Millennials integrate social media into their broader shopping journey, even when checkout happens elsewhere.
Why don't social commerce numbers match across reports?
Three reasons: (1) different definitions of what counts as a "social commerce" purchase (narrow / middle / broad); (2) different sample populations (US online consumers vs. US social network users vs. global); (3) different methodologies (consumer survey vs. transaction tracking vs. forecast modeling). The same metric — "global social commerce 2025" — has been reported as $821B, $1.1T, and $2T+ depending on the source. They're not contradicting each other; they're measuring different things. Always cite the definition with the figure.
What is live commerce and how big is it?
Live commerce is the practice of selling products through live video streams. It's massively scaled in Southeast Asia (Bain's e-Conomy SEA 2025 reports video commerce accounts for ~25% of total SEA e-commerce GMV) but only 12% of Western consumers have ever participated in a livestream shopping event (Bazaarvoice 2025). On TikTok Shop US, live commerce grew from 10% to 14% of GMV share between 2024 and 2025 — and during BFCM 2025 alone, TikTok logged 760,000+ livestream sessions with 1.6 billion views (TikTok Newsroom).
How much do creators earn from social commerce?
The number of TikTok Shop creators earning commissions grew 146% YoY in 2025 — with over 16,000 creators generating six-figure or higher sales (Modern Retail). 1,785 TikTok Shop influencers exceeded $1M in GMV in 2025, up from 529 the prior year (Momentum Works). Total US social media creator revenue is forecast to reach $20.6B in 2026 (+16.2% YoY per eMarketer). Globally, Goldman Sachs estimates approximately 67M content creators in 2025, growing at ~10% CAGR to ~107M by 2030.
What is the cart abandonment rate for social commerce?
Overall e-commerce cart abandonment is 70.22% (Baymard Institute, September 2025). There is no verifiable primary-source figure for cart abandonment specifically tied to social commerce traffic. The widely-circulated "91% social cart abandonment" figure does not appear in Baymard's data and cannot be traced to a primary source — we recommend not citing it.
How much do brands spend on social commerce vs social ads?
Brands spend more on advertising on social platforms than the total revenue generated through them. US social network ad spending will exceed $121 billion in 2026 — roughly 32% of total US digital ad spend (eMarketer H2 2025 forecast). Total US social commerce sales for 2026 are forecast at $100B+ (eMarketer). The gap closes meaningfully in 2027–2028 as in-app checkout matures.
What are the main barriers to social commerce growth?
The three biggest barriers cited in 2025–2026 research: (1) Influencer trust gap — 26% of US consumers don't trust influencer marketing (vs 11% for advertising overall), and 64% distrust influencers who don't disclose brand relationships (eMarketer); (2) In-platform purchase friction — Forrester's July 2025 analysis specifically flags that in-platform purchasing has not yet hit critical mass in the US, with consumer trust and broader friction barriers remaining high; (3) Platform-policy and product safety risk — TikTok Shop alone proactively rejected 40M+ products in H1 2025 (TikTok Newsroom).
Will social commerce overtake traditional e-commerce?
Not by 2030, in the US. Social commerce is forecast to reach 9.3% of US retail e-commerce by 2029 (eMarketer) — meaningful growth from 6.9% in 2025, but still under 10% of the total. Globally, the picture differs sharply by region: in Southeast Asia, video commerce already represents ~25% of e-commerce GMV (e-Conomy SEA 2025). The US trajectory looks more like the SEA trajectory shifted ~5 years later — significant growth, but not displacement.
Which demographic spends the most on social commerce?
By age: roughly one-third of US adults aged 18–34 have purchased on social media, vs 23% of 35–54-year-olds and 13% of 55–65-year-olds (eMarketer). By race/ethnicity in the US: Hispanic adults have the highest TikTok adoption rate (57% per Pew Research Center, November 2025) — meaningful for TikTok Shop's penetration. By geography, India and Southeast Asia consumers are years ahead of the US on social-driven purchase behavior.
Is social commerce different in China and Asia vs the US?
Dramatically yes. In Southeast Asia, video commerce is ~25% of all e-commerce GMV (Bain e-Conomy SEA 2025), and TikTok Shop GMV doubled YoY to $45.6B in 2025 (Momentum Works). In Singapore alone, video commerce sellers grew 125% YoY to 80,000. By contrast, only 12% of Western consumers have ever participated in a livestream shopping event (Bazaarvoice). Western adoption is currently 5–7 years behind Asian markets on social-commerce penetration.
What are the most popular product categories in social commerce?
While we couldn't verify category-level GMV breakdowns from a primary source for 2026, the brands most commonly cited as scaling on TikTok Shop in 2025–2026 (per Modern Retail) include beauty (Ulta Beauty, Sally Beauty entered TikTok Shop in 2025), apparel, home goods, and food/beverage. Big brands with $10M+ in revenue grew TikTok Shop sales 76% YoY in 2025 — a faster growth rate than the platform overall, suggesting category breadth is widening.
Is social commerce growing faster than e-commerce overall?
Yes, by a wide margin. Global e-commerce is forecast to grow ~7.2% in 2026 to $6.8T+ (Sprout Social citing eMarketer). US social commerce is growing 18% in 2026 (eMarketer). Adobe reports that social media's share of US online holiday revenue grew 40.3% YoY in the 2025 holiday season — the fastest-growing channel they tracked. Whatever the absolute size, social commerce is gaining share against every alternative channel.
What's the impact of generative AI on social commerce?
Adobe's most striking 2025–2026 holiday data point: traffic to retail sites from generative AI tools increased 693.4% YoY for the full holiday season, and 670% on Cyber Monday alone (Adobe Holiday Shopping release, January 2026). 55% of consumers now trust GenAI shopping tools, rising to 75% among 18–34-year-olds (Bazaarvoice 2025). The next 12–24 months of social commerce growth will be shaped as much by AI-driven product discovery as by platform-native shopping features.
Final Thoughts + Quick Reference Checklist
If you're using social commerce stats in pitches, decks, or reports, run this checklist before you cite anything:
- ✅ Did I check which definition the source uses (narrow / middle / broad)?
- ✅ Am I citing the primary source, not a blog roundup that quoted the primary?
- ✅ Is the figure from 2025 or 2026, not older data dressed up as current?
- ✅ Am I distinguishing between US, Asia, and global figures (they're not interchangeable)?
- ✅ Am I separating social ad spend from social commerce GMV (different metrics, different scales)?
- ✅ Did I disclose methodology caveats when comparing across sources?
- ✅ For Meta, YouTube, or Snap shopping figures: am I aware that none of these platforms publishes a primary GMV number?
The single biggest mistake in social commerce reporting in 2026 is treating the headline number as the answer. The headline is the first question. The follow-up — which definition, which population, which year — is what produces an honest answer.
Try PostPlanify free for 7 days — if you're managing TikTok Shop, Pinterest, Instagram, or any of the 10 supported platforms, our cross-platform analytics, AI-powered content variations, and white-label reporting put the operational side of social commerce on one dashboard.
Also read: Social Media Engagement Rate Benchmarks 2026 — the companion stats article on how engagement actually performs across the same platforms covered here.
Related: Best Time to Post on TikTok | Best Times to Post on Pinterest | How to Schedule TikTok Posts | How to Schedule Pinterest Pins | Social Media Engagement Rate Benchmarks 2026 | Social Media Analytics for Business | How to Measure Social Media ROI | Social Media Marketing Strategy for Small Business | Instagram Content Strategy | Social Media Best Practices | Social Media Analytics and Reporting
All your social media in one simple dashboard
Schedule posts, track analytics, and reply to comments/DMs — without switching tabs.
Engagement
+18%
Views
52.8k
About the Author

Hasan Cagli
Founder of PostPlanify, a content and social media scheduling platform. He focuses on building systems that help businesses, agencies, and teams plan, publish, and manage content and social media more efficiently across platforms.


