
If you've searched for "social media engagement rate benchmarks" in 2026, you've already seen the problem: every report says something different.
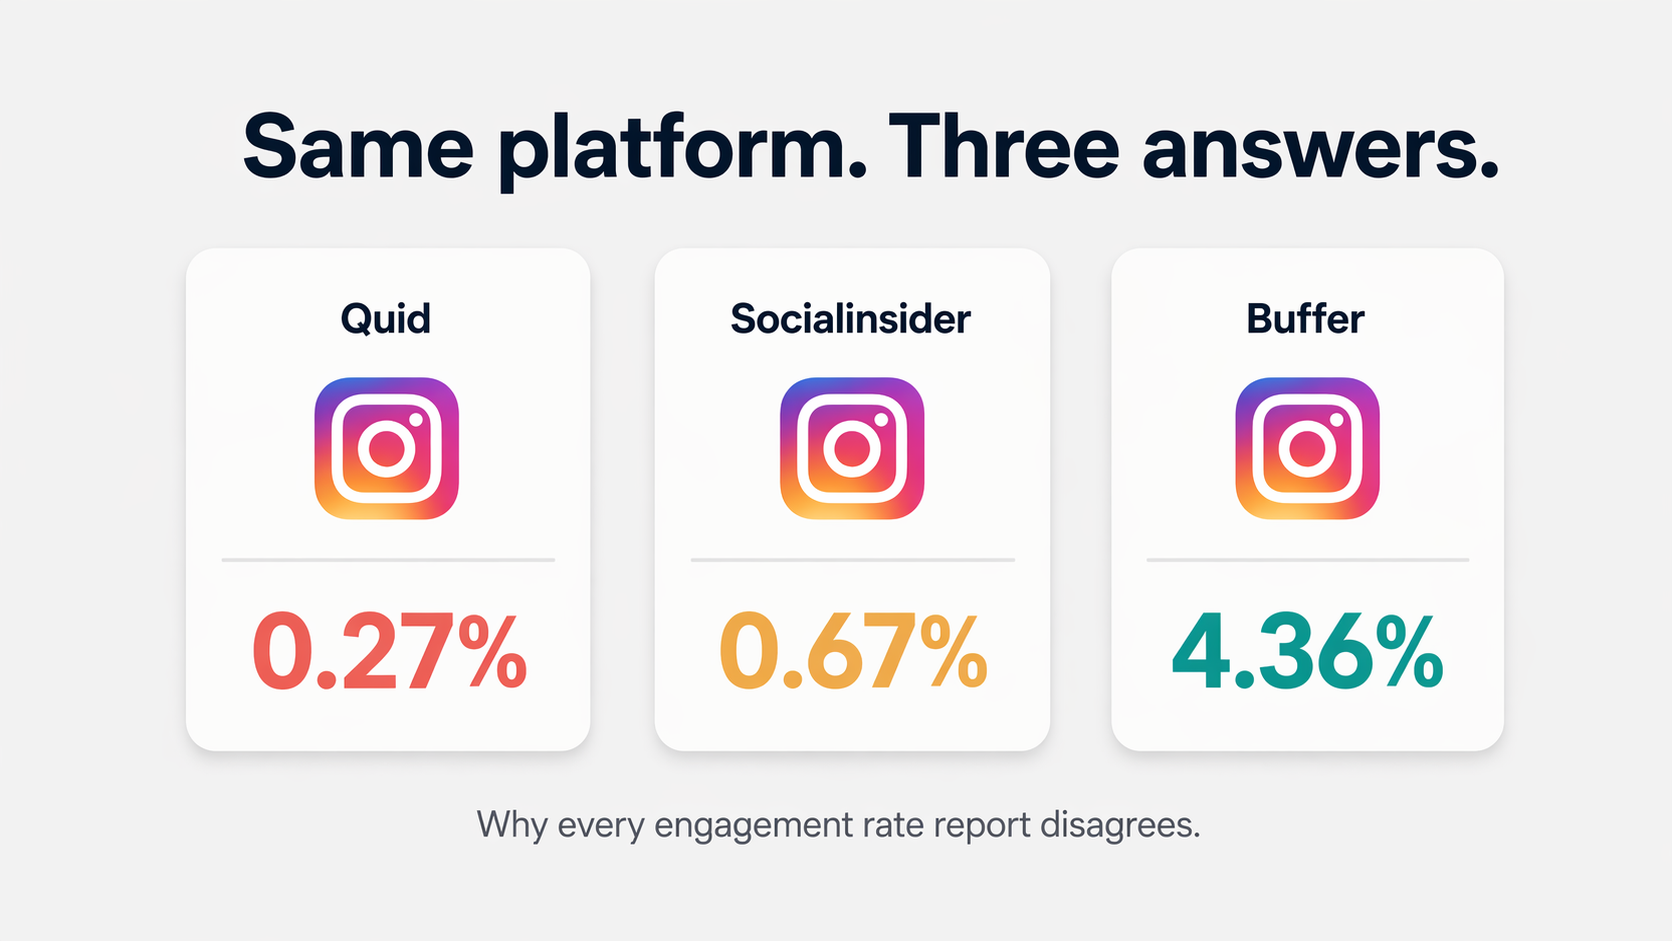
Quid puts Instagram's median engagement rate at 0.30%. Socialinsider's 2026 report says 0.48%. Buffer's dataset says 5.46%. Same platform, same year, same metric — three answers that differ by 18×.
They're all correct. They're using different formulas on different samples. No canonical article currently reconciles this — which is exactly why marketers, agencies, and journalists keep citing the wrong number in the wrong context.
This guide fixes that. We pulled engagement rate data from six Tier 1 primary sources published between December 2025 and April 2026 — Quid, Socialinsider, Metricool, Buffer, Sprout Social, and DataReportal — and reconciled every figure against the formula that produced it. No blog-to-blog citations. No stale numbers from 2023 disguised as current.
You'll get:
- The single reference table showing every platform's engagement rate under all three formulas (followers, reach, impressions)
- Industry-level benchmarks for 14 verticals from Quid's 2026 report
- Account-size splits (nano vs. enterprise — they are not the same)
- YoY trends: what's rising, what's falling, and why Facebook just had a comeback year
- Fresh data on Threads, Bluesky, and Google Business Profile
- A clear rule for what counts as a "good" engagement rate in 2026
Everything is sourced inline. Every source is linked. The full methodology is at the bottom. Let's get into it.
TL;DR — The 30-Second Answer
- TikTok still leads. Median engagement: 2.01% (Quid 2026), 4.20% (Socialinsider 2026, +9% YoY).
- Instagram declined ~17% YoY to 0.30% median (Quid 2026) — the third straight year of decline.
- Facebook just rebounded. Reach +51%, impressions +57%, interactions +56% (Metricool 2026).
- LinkedIn engagement is up 14% but likes, comments, and shares are all down — clicks replaced public interactions (Metricool LinkedIn Study April 2026).
- LinkedIn carousels hit 21.77% median engagement — 3× video and images (Buffer 2026).
- Small accounts out-engage big ones on every platform. Nano-influencers (1K–10K) hit ~6.23% on Instagram vs. 1–3% for mega accounts (Influencer Marketing Hub 2026).
- X (Twitter) saw its first engagement gain in years — +44% YoY in Buffer's dataset.
- Threads is punching above its weight with ~25 interactions per post on 1,536 average impressions (Metricool 2026).
- Higher Ed, Sports Teams, and Influencers are the top-performing industries in 2026 (Quid).
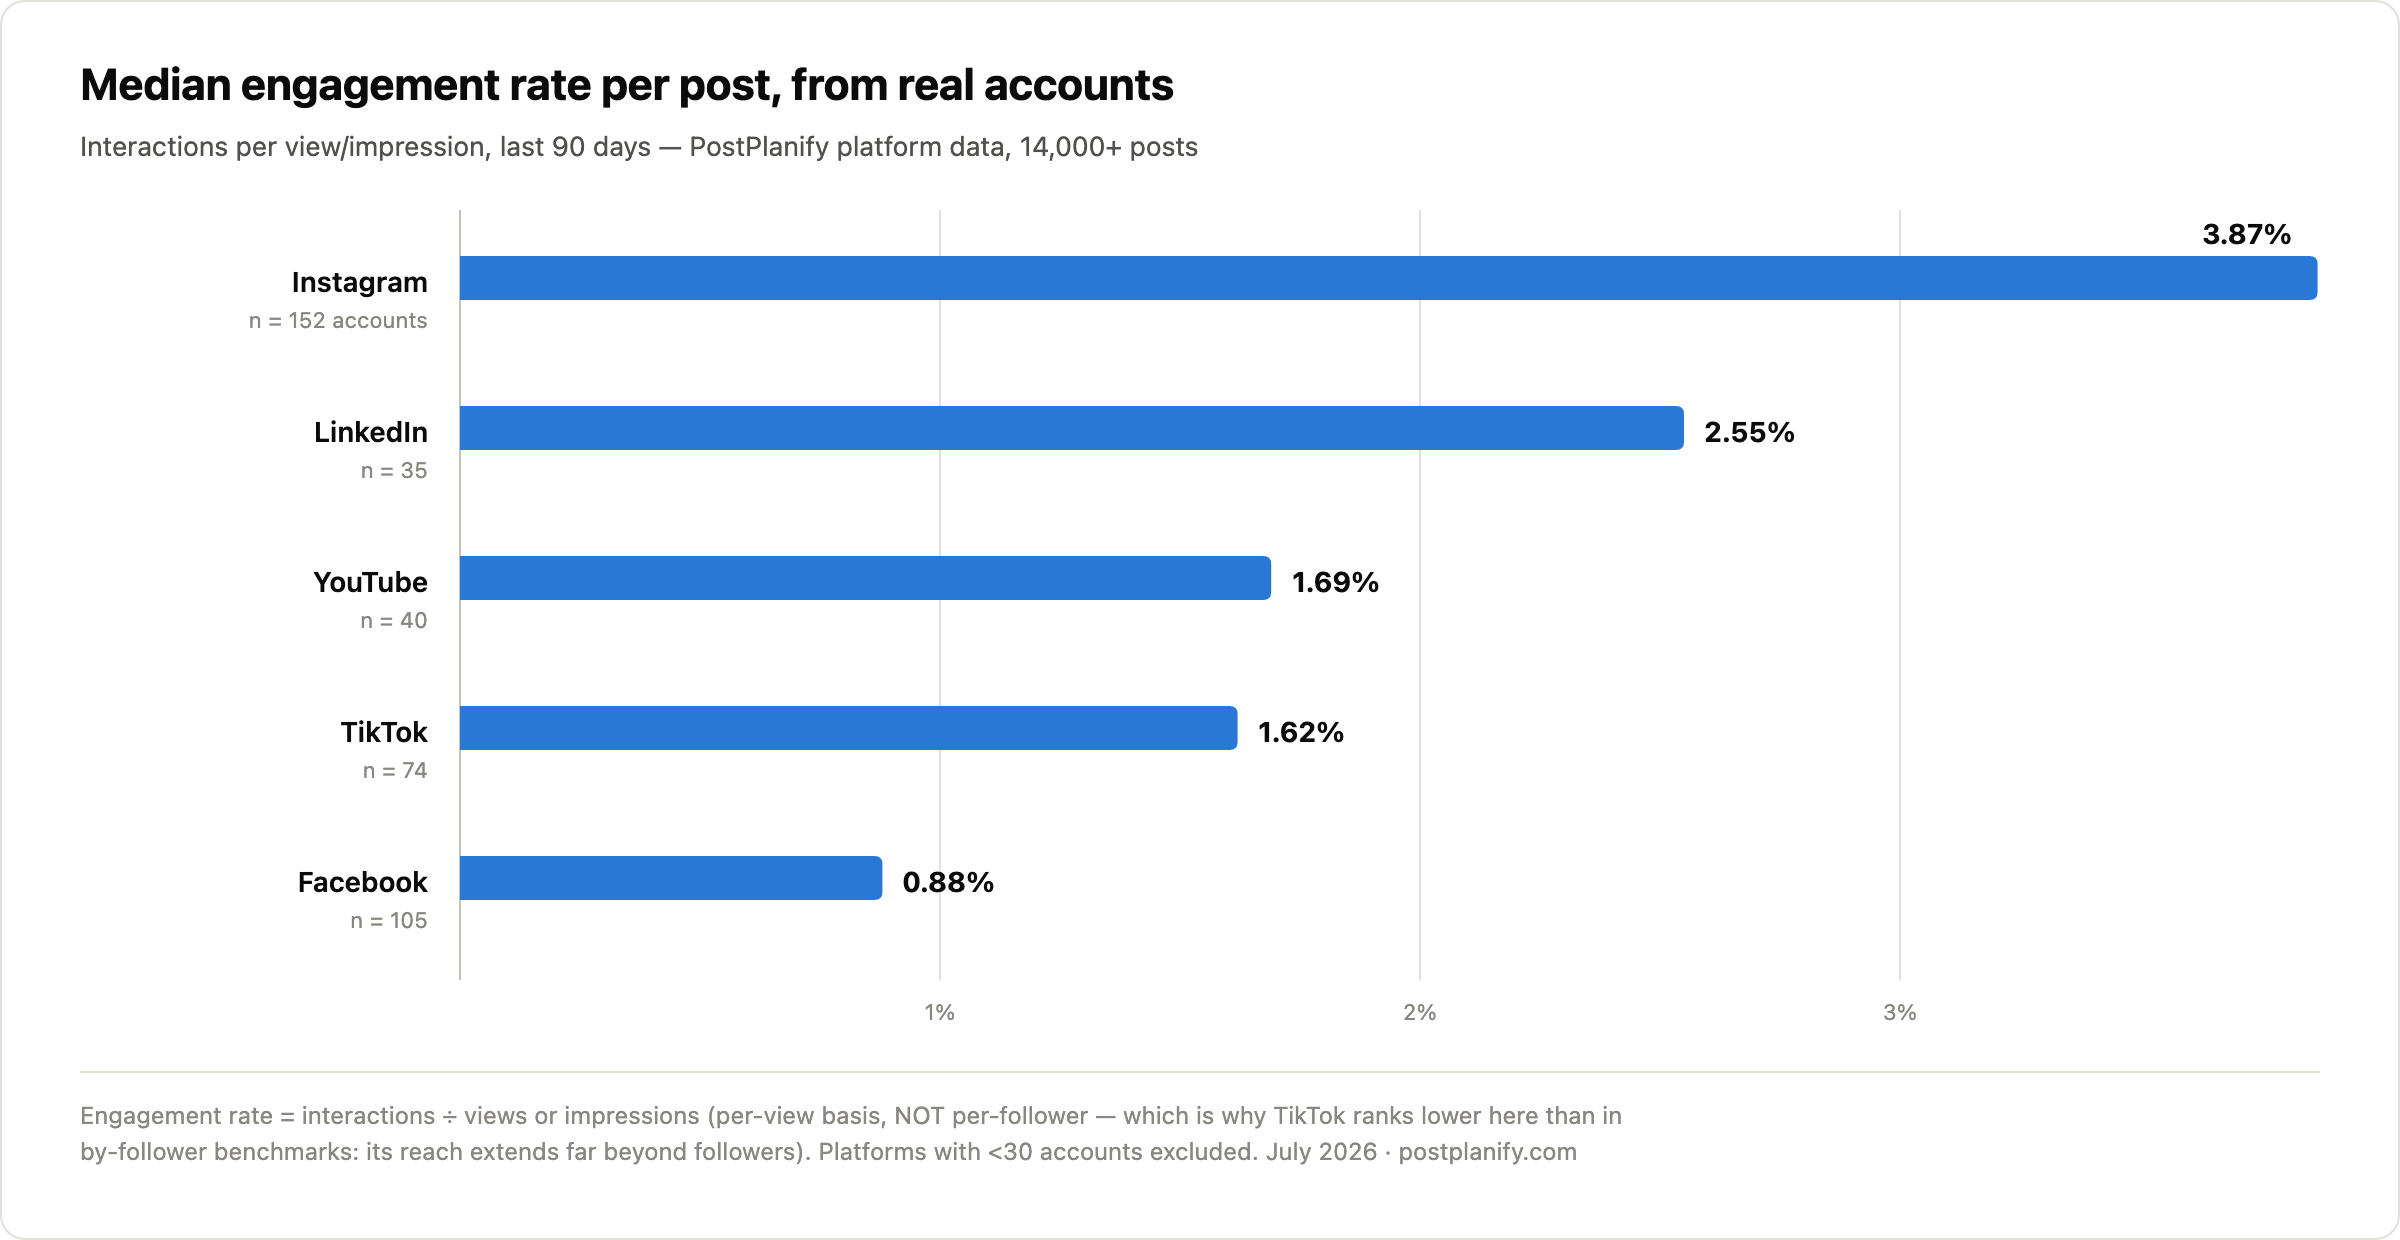
- New — first-party data: across 14,000+ posts from 580 SMB-weighted accounts on PostPlanify, median per-view engagement runs Instagram 3.87% > LinkedIn 2.55% > YouTube 1.69% > TikTok 1.62% > Facebook 0.88% (details below).
- Beauty and Retail are saturated — below-median across every channel (Quid).
Quick Reference: Engagement Rate by Platform in 2026 (Reconciled)
This is the table everyone needs but no one publishes. It shows the same platform under three different formulas, side by side, with the primary source cited for each figure.
| Platform | Follower-based (Quid 2026) | Reach/View-based (Socialinsider 2026) | Impression-based (Buffer 2026) | YoY direction |
|---|---|---|---|---|
| 0.30% | 0.48% | 5.46% | ↓ Down ~17–24% | |
| TikTok | 2.01% | 4.20% | — | ↑ Up +9% (view-based) |
| ~0.02% | — | — | Flat; reach rebounded +51% | |
| — | — | 21.77% (carousels) | ↑ Up +14% overall | |
| X (Twitter) | 0.03% | — | ~2.8% | ↑ First gain in years (+44% Buffer) |
| YouTube | — | — | — | ↑ Views +30%, comments +7% |
| Low, declining | — | — | ↓ Continued decline | |
| Threads | — | ~25 interactions / 1,536 imps | — | ↑ Growing |
| Bluesky | Not calculable | 16.38 interactions/post (raw) | — | ↑ Growing |
| Google Business | — | — | — | Stable |
➕ New for July 2026: this page now also includes PostPlanify's own first-party benchmarks — per-view medians from 580 real small-to-mid-size accounts, the segment the reports above underweight.
⚠️ Do not compare these columns against each other without labeling the formula. Buffer's 5.46% for Instagram and Quid's 0.30% are both correct — they're measuring different things. The next section explains exactly what.
Sources: Quid 2026 Social Media Industry Benchmark Report, Socialinsider 2026 Benchmarks, Buffer State of Social Media Engagement 2026, Metricool 2026 Social Media Study.
Why Every Benchmark Report Shows a Different Number
The engagement rate gap across sources isn't a mistake. It's math. Each major publisher uses a different denominator, and the denominator changes the number more than the numerator ever will.
Here's what each source is actually measuring:
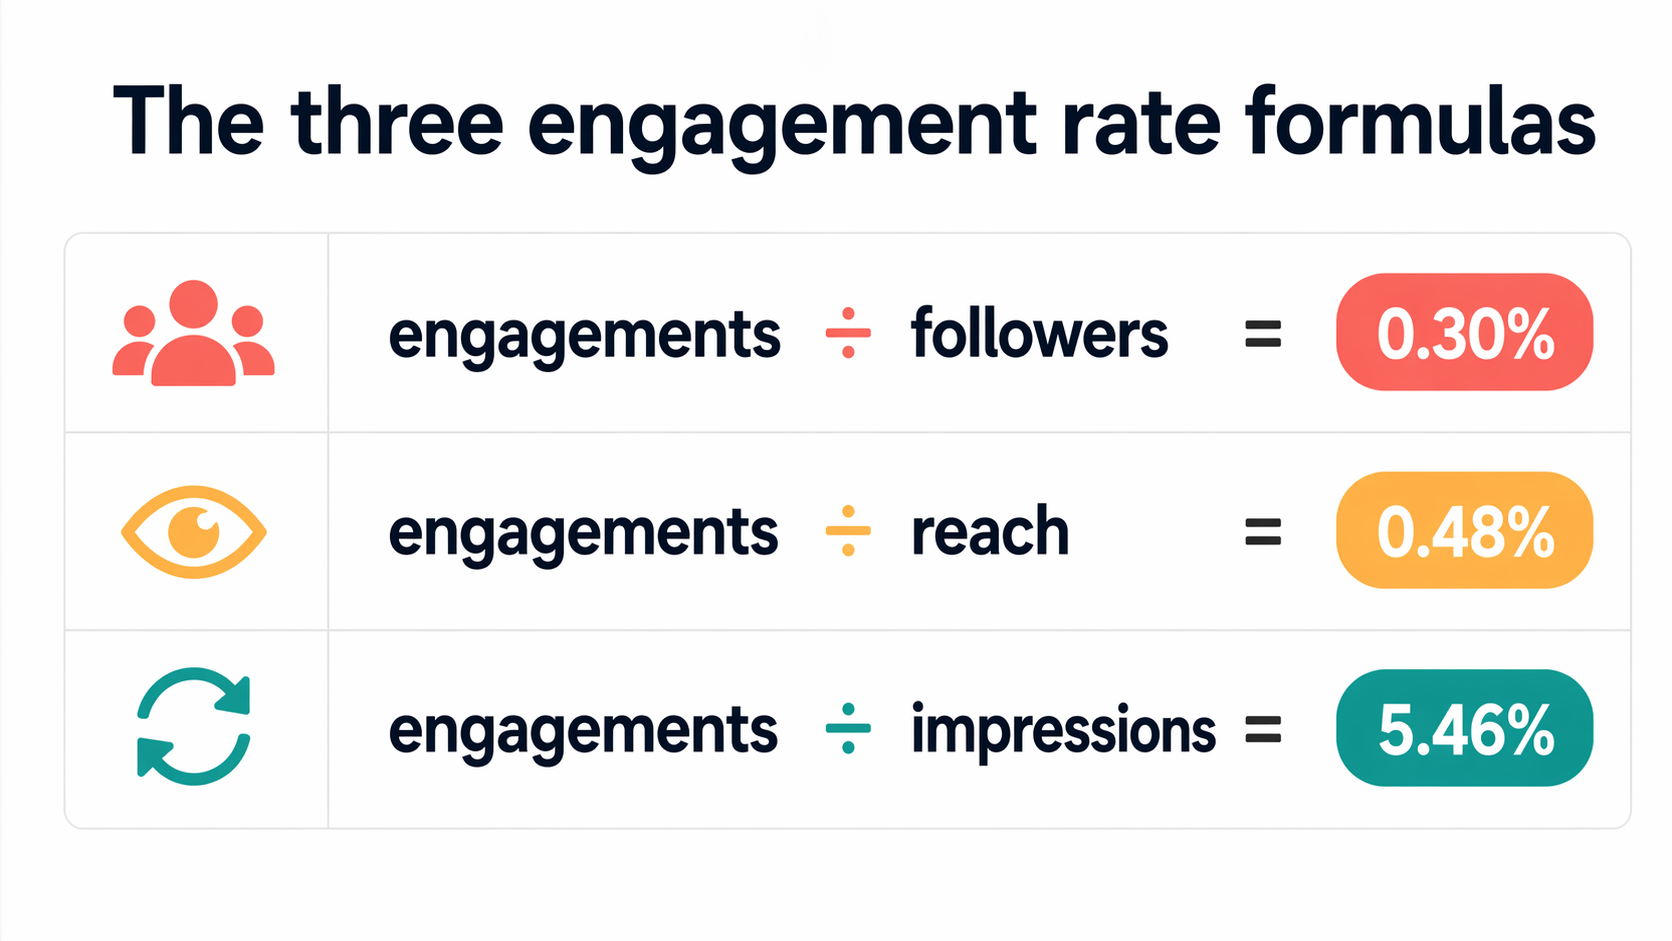
The three engagement rate formulas explained
| Formula | Denominator | Used by | Instagram result |
|---|---|---|---|
| By follower | Total followers | Quid, Rival IQ (legacy), Hootsuite | 0.30% |
| By reach / view | Unique accounts reached (or views on video) | Socialinsider, Sprout Social | 0.48% |
| By impression | Total times content was served | Buffer, Meta Business Suite analytics | 5.46% |
Why the same post produces three different percentages
Take a post with 10,000 engagements on an account with 500,000 followers, 200,000 reach, and 25,000 impressions (impressions < reach can happen with short-form video views vs unique viewers):
- By follower: 10,000 ÷ 500,000 = 2.0%
- By reach: 10,000 ÷ 200,000 = 5.0%
- By impression: depends on how "impressions" is defined by the platform — typically larger than reach for most posts, giving a smaller %; for short-form video where views are counted differently, can be smaller than reach, giving a larger %
The key insight: organic reach has cratered. When you divide engagements by followers, most of those followers didn't see the post — so the denominator is artificially inflated and the percentage looks tiny. When you divide by reach or impressions, you're measuring engagement against people who actually saw the content — and that's a much more honest metric of content quality.
Which formula should you use?
| If you're… | Use this formula | Why |
|---|---|---|
| Comparing your content performance over time | Engagement by reach | Removes algorithm-driven reach decline from the calculation |
| Benchmarking against an industry report | Match whichever formula the report used | Mixing formulas produces meaningless comparisons |
| Reporting to a client or stakeholder | Engagement by reach + total reach | Reach context prevents misinterpretation |
| Measuring ad-driven content | Engagement by impression | Ad platforms report impressions natively |
| Judging content on a zero-growth account | Engagement by follower | Denominator is stable, removes one variable |
👉 If your scheduling or analytics tool doesn't show the formula it uses, ask or switch. PostPlanify's analytics lets you see engagement per follower and engagement per reach across all 10 platforms in the same dashboard, so you're never stuck comparing apples to oranges.
Engagement Rate by Platform: The Detailed Breakdown
Each of the major platforms now deserves its own methodology note. Below, the current 2026 benchmarks by platform — with every number tied to a single primary source.
Instagram engagement rate benchmarks 2026
Instagram has seen three consecutive years of engagement decline in every major benchmark report.
| Metric | Value | Source |
|---|---|---|
| All-industry median engagement rate (by follower) | 0.30% (−17% YoY) | Quid 2026 |
| All-industry median engagement rate (by view) | 0.48% (−24% YoY) | Socialinsider 2026 |
| Reels median engagement rate | 0.52% | Socialinsider 2026 |
| Carousel median engagement rate | 0.55% | Socialinsider 2026 |
| Static image median engagement rate | 0.37% | Socialinsider 2026 |
| Reach YoY change | −31% | Metricool 2026 |
| Reels reach YoY change | −35% | Metricool 2026 |
| Nano-influencer (1K–10K) engagement | ~6.23% | Influencer Marketing Hub 2026 |
| Mega-influencer (500K+) engagement | 1–3% | Influencer Marketing Hub 2026 |
What this means: the Instagram engagement-rate problem is really a reach problem. Followers are technically there; the algorithm just isn't showing them your content. The platforms that are actually getting the reach (Reels via FYP-style distribution) aren't translating into higher engagement rates because the audience is passive. For a deeper breakdown of Instagram content formats, see our Instagram carousel guide and our Instagram Reels algorithm guide.
TikTok engagement rate benchmarks 2026
TikTok is the last major platform where engagement is still growing in 2026.
| Metric | Value | Source |
|---|---|---|
| Brand engagement rate (by follower) | 2.01% | Quid 2026 |
| Overall engagement rate (by view) | 4.20% (+9% YoY) | Socialinsider 2026 |
| 2025 baseline (by view) | 3.85% | Socialinsider 2025 |
| Small accounts (1K–5K followers) | 4.40% | Socialinsider 2026 |
| Mid-tier accounts (50K–100K followers) | 3.75% | Socialinsider 2026 |
Why the gap between 2.01% and 4.20%? Quid measures TikTok brand accounts against their followers. Socialinsider measures total engagements against views. TikTok's algorithm surfaces content far beyond the follower base — which inflates reach and suppresses the follower-based rate, while the view-based rate reflects actual performance against the audience that saw the content.
Facebook engagement rate benchmarks 2026
Facebook engagement rate has hovered near zero for five years. But 2026 is the year Facebook reach came back.
| Metric | Value | Source |
|---|---|---|
| All-industry median engagement rate (by follower) | ~0.02% (flat) | Quid 2026 |
| Reach YoY change | +51% | Metricool 2026 |
| Impressions YoY change | +57% | Metricool 2026 |
| Interactions YoY change | +56% | Metricool 2026 |
What this means: Meta quietly prioritized Facebook reach in 2026. The engagement rate stayed flat because total reach went up in proportion to total engagements. For marketers, this is actually good news — the same content now hits more people even if the % looks unchanged. If you abandoned Facebook as a channel between 2022 and 2024, this is the year to reconsider. For scheduling guidance, see how to schedule Facebook posts.
LinkedIn engagement rate benchmarks 2026
LinkedIn is the most nuanced platform in 2026 because overall engagement is up, but every traditional public metric is down.
| Metric | Value | Source |
|---|---|---|
| Overall engagement YoY change | +14% | Metricool LinkedIn Study April 2026 |
| Likes YoY change | −13% | Metricool 2026 |
| Comments YoY change | −17% | Metricool 2026 |
| Shares YoY change | −10% | Metricool 2026 |
| Personal profile vs Company Page engagement | +63% higher | Metricool 2026 |
| Carousel median engagement rate | 21.77% | Buffer 2026 |
| Carousel vs video/image lift | ~3× higher | Buffer 2026 |
What this means: clicks have replaced public interactions. Users are still consuming content — they're just not leaving fingerprints on it. The "quiet engagement" era on LinkedIn means reply-based metrics and save rates matter more than like counts. The 21.77% median for LinkedIn carousels is the single highest format-level engagement rate in any 2026 benchmark dataset. If you're not already testing carousels, that's the first format to prioritize. See also: how to schedule LinkedIn posts.
X (Twitter) engagement rate benchmarks 2026
X had its first engagement gain in several years.
| Metric | Value | Source |
|---|---|---|
| All-industry median engagement rate (by follower) | 0.03% | Quid 2026 |
| Engagement rate YoY change | +44% | Buffer 2026 |
| 2026 engagement (impression-based) | ~2.8% | Buffer 2026 |
What this means: X's platform-wide recovery was driven by heavier replies and thread formats, not by follower-count-dependent virality. Replies remain the single highest-engagement unit on X. Note: Buffer's impression-based X figure is not directly comparable to Quid's follower-based 0.03% — the denominators are different.
YouTube engagement rate benchmarks 2026
YouTube doesn't publish a single "engagement rate" metric the same way image-first platforms do — it's view-and-watch-time-driven. But directional metrics are all up.
| Metric | Value | Source |
|---|---|---|
| Views YoY change | +30% | Metricool 2026 |
| Weekly posts YoY change | +25% | Metricool 2026 |
| Comments YoY change | +7% | Metricool 2026 |
What this means: YouTube Shorts is pulling the curve upward, and long-form video is more competitive than any point in the last three years. For Shorts-specific scheduling, see how to schedule YouTube Shorts.
Pinterest engagement rate benchmarks 2026
Pinterest's benchmarks continued to soften. Engagement rates remain structurally lower than social platforms because Pinterest is a discovery platform, not a conversation platform — "engagement" typically means saves and click-throughs rather than comments.
Most agency reports cite Pinterest engagement below 0.1% when calculated in social-media-style formulas, but Pinterest's own internal metric (Idea Pin save rate) is a more meaningful benchmark for the platform. Primary Pinterest data from vendor-published benchmark reports is sparse for 2026; most reports default to 2024 data.
PostPlanify First-Party Benchmarks (July 2026)
New in the July update: our own dataset. In PostPlanify's analysis of 14,000+ posts from 580 accounts connected to our platform (90-day window, July 2026), the median engagement rate per post — interactions ÷ views or impressions, so the per-view formula — ranked like this:
| Platform | Median ER per post | Top quartile | Accounts |
|---|---|---|---|
| 3.87% | 7.29% | 152 | |
| 2.55% | 5.71% | 35 | |
| YouTube | 1.69% | 4.32% | 40 |
| TikTok | 1.62% | 3.86% | 74 |
| 0.88% | 2.08% | 105 |
Two things make this dataset different from the Tier 1 reports above — and both matter for how you use it:
1. It's small-account-weighted, which is probably you. Quid and Socialinsider medians are pulled toward large brand accounts. Our sample skews small-to-mid businesses, agencies' client accounts, and creators — which is why our Instagram median (3.87% per view) sits far above Socialinsider's big-brand-weighted 0.48%, and consistent with the nano/micro advantage documented in the account-size section below. If you run a normal-sized account, these numbers are closer to your reality than any headline median.
2. It shows the per-view formula reversing the famous TikTok-vs-Instagram ranking. By follower, TikTok dwarfs Instagram (2.01% vs 0.30%). Per view, Instagram leads our table at 3.87% vs TikTok's 1.62% — because TikTok's algorithm shows videos to enormous audiences of non-followers, inflating the denominator. When an Instagram post reaches someone, they're about 2.4× more likely to interact with it than a TikTok viewer. Neither number is wrong; they answer different questions (TikTok = discovery efficiency, Instagram = audience connection).
Related first-party findings from the same dataset, published in our companion guides: accounts posting 3–5 times a week grew followers at a median +15.3% over ~90 days vs +3.8% for 1–2 posts a week (posting frequency data); only 39.7% of accounts held a consistent 20-of-26-week posting schedule; and Instagram accounts at the 3–5/week cadence roughly doubled their median reach per post with engagement rate unchanged (platform comparison data).
Methodology: medians per post, not averages; interactions ÷ views or impressions as exposed by each platform's API; platforms with fewer than 30 measured accounts (X, Pinterest, Threads, Bluesky) excluded rather than reported on thin data; posts synced via official platform APIs covering all account activity, not only posts published through PostPlanify. Refreshed quarterly with this page.
All your social media in one simple dashboard
Schedule posts, track analytics, and reply to comments/DMs — without switching tabs.

Engagement
+18%
Views
52.8k
This dataset also powers our platform-specific analytics guides, where each platform gets a deeper cut of the numbers plus tool comparisons for tracking your own: Instagram, TikTok, LinkedIn, YouTube, and Facebook.
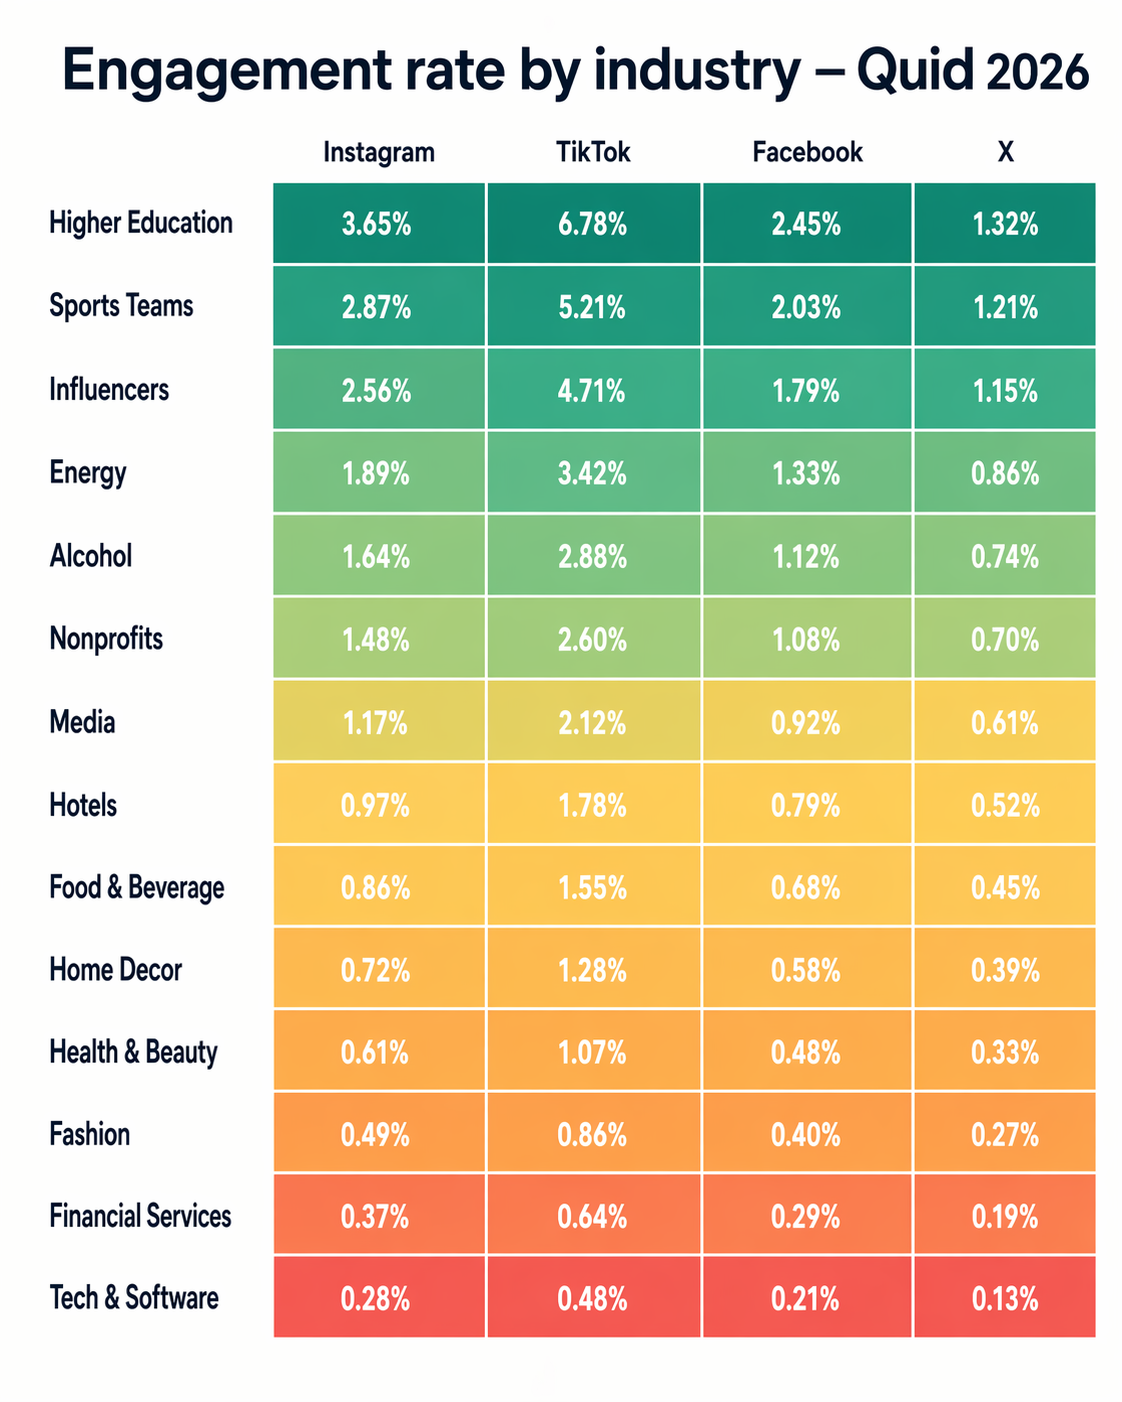
Engagement Rate by Industry (14 Verticals)
Quid's 2026 Social Media Industry Benchmark Report analyzed 18 industries across Instagram, TikTok, Facebook, and X, with YouTube added as a new vertical for 2026. Here's how they cluster.
Top performers (above the all-industry median on most platforms)
| Industry | Why they outperform |
|---|---|
| Higher Education | Community loyalty, niche interest, sports tie-ins |
| Sports Teams | Passionate fanbases, event-driven spikes, video-heavy |
| Influencers | Personal content, reply-driven, nano/micro advantage |
| Energy / Pharma | Low posting frequency → every post saturates small audience |
| Alcohol | Lifestyle imagery, established creative formats |
Middle tier (near the all-industry median)
| Industry | Notes |
|---|---|
| Nonprofits | Mission-driven content holds steady; lost some ground on Facebook |
| Media | Volume-heavy — dilutes per-post engagement but high total engagement |
| Hotels & Resorts | Visual content benefits Instagram; softer on TikTok |
| Food & Beverage | Still above-median on Instagram; below on LinkedIn |
| Home Decor | Pinterest-dependent; middle-of-pack elsewhere |
Below the median (saturated or struggling)
| Industry | What's driving the decline |
|---|---|
| Health & Beauty | Oversaturation; content fatigue |
| Fashion / Retail | Oversaturation; ad-driven audiences, lower organic engagement |
| Financial Services | Compliance-constrained creative; lowest consistent benchmark industry |
| Tech / Software | Professional audience prefers LinkedIn over broad-market platforms |
Key takeaway: if you're in Beauty, Retail, or Financial Services, comparing yourself against the all-industry median will make you look worse than you actually are. Always compare within your vertical — Quid's full 2026 report has the industry-specific numbers.
Engagement Rate by Account Size
One of the most consistent findings across Socialinsider, Buffer, and Metricool in 2026: smaller accounts out-engage larger accounts on every platform.
The nano-to-mega split (Instagram, 2026)
| Account size | Follower range | Median engagement rate |
|---|---|---|
| Nano-influencer | 1K – 10K | ~6.23% |
| Micro-influencer | 10K – 100K | ~2.5% |
| Mid-tier | 100K – 500K | ~1.8% |
| Macro | 500K – 1M | ~1.5% |
| Mega | 1M+ | 1% – 3% |
Source: Influencer Marketing Hub 2026 Benchmark Report. Tier-based averages; methodology varies.
The same pattern on TikTok
| Account size | Median engagement rate |
|---|---|
| 1K – 5K followers | 4.40% |
| 50K – 100K followers | 3.75% |
Source: Socialinsider 2026.
First-party check: the small-account advantage has a floor (PostPlanify data)
Our own Instagram data (July 2026, per-view formula) confirms the small-account advantage — but adds a nuance no vendor report documents:
| Account size | Accounts | Median ER per post |
|---|---|---|
| Under 1K followers | 90 | 2.78% |
| 1K – 10K followers | 38 | 4.36% |
The advantage doesn't start at zero — it starts around 1K followers. Sub-1K accounts in PostPlanify's dataset engage below the 1K–10K tier, not above it: brand-new and dormant accounts haven't built the community density that drives the nano-account numbers you see in influencer reports. If your account is under 1K followers and your engagement rate looks "below benchmark," that's the expected pattern, not a content failure — the compounding starts once a real community forms. (Our 10K–100K sample reads directionally similar to the 1K–10K tier at ~4.4%, but at 21 accounts it's below our 30-account publishing threshold, so treat that as indicative only; 100K+ accounts were excluded entirely on sample size.)
What this means for agencies and SMBs: the all-industry median number you see in a headline is pulled toward large brand accounts. If you're running a 5K-follower account and comparing to "Instagram's 0.30% median," you should actually be outperforming it by 10–20×. If you're not, that's the real signal to investigate.
For creator-leaning accounts specifically, our guide on how to grow Instagram followers organically covers the mechanics.
Engagement Rate by Content Format
Format choice now matters more than posting frequency or time-of-day optimization. The 2026 data is unambiguous.
The format leaderboard (2026)
| Format | Platform | Median engagement rate | Source |
|---|---|---|---|
| LinkedIn carousel (PDF) | 21.77% | Buffer 2026 | |
| TikTok native video | TikTok | 4.20% | Socialinsider 2026 |
| Nano-influencer post | ~6.23% | Influencer Marketing Hub 2026 | |
| Instagram carousel | 0.55% | Socialinsider 2026 | |
| Instagram Reels | 0.52% | Socialinsider 2026 | |
| Instagram static image | 0.37% | Socialinsider 2026 | |
| LinkedIn video | ~7% | Buffer 2026 | |
| LinkedIn image | ~6% | Buffer 2026 |
First-party check: the Reels reach trade, quantified (PostPlanify data)
The same trade-off shows up in PostPlanify's Instagram data (July 2026) — but the reach gap is far bigger at small-account scale than the headline reports suggest:
| Format | Accounts | Median ER per post | Median reach per post |
|---|---|---|---|
| Image / video post | 105 | 4.72% | 31 |
| Carousel | 96 | 4.41% | 34 |
| Reels | 128 | 3.42% | 314 |
For small-to-mid accounts, Reels deliver roughly 10× the median reach of static posts and carousels while giving up about a point of engagement rate. That's a trade worth making for growth — Reels are how non-followers find you — while carousels and images are how the audience you already have engages. The 2026 playbook for small accounts writes itself: Reels for reach, carousels for connection, both every week.
The four format rules that actually matter in 2026:
- Carousels beat everything else on LinkedIn — 3× the median engagement of video or images. If you're not publishing LinkedIn carousels weekly, start this week.
- On Instagram, carousels still slightly edge Reels (0.55% vs 0.52%). Reels wins on reach; carousels win on engagement.
- Static images are the lowest-engagement format on Instagram (0.37%). They're still useful for brand consistency, but don't expect them to drive engagement metrics.
- Replies outperform posts across Threads (+42%), LinkedIn (+30%), and Instagram (+21%) in terms of lift per engagement action (Buffer 2026).
For format-by-format scheduling, our guides on how to schedule carousel posts, Instagram Reels, and Instagram stories walk through the exact workflows.
All your social media in one simple dashboard
Schedule posts, track analytics, and reply to comments/DMs — without switching tabs.
Engagement
+18%
Views
52.8k
YoY Trends: What's Rising and What's Falling in 2026
The most useful way to read the 2026 data is by direction, not absolute numbers. Here's who's up, who's down, and why.
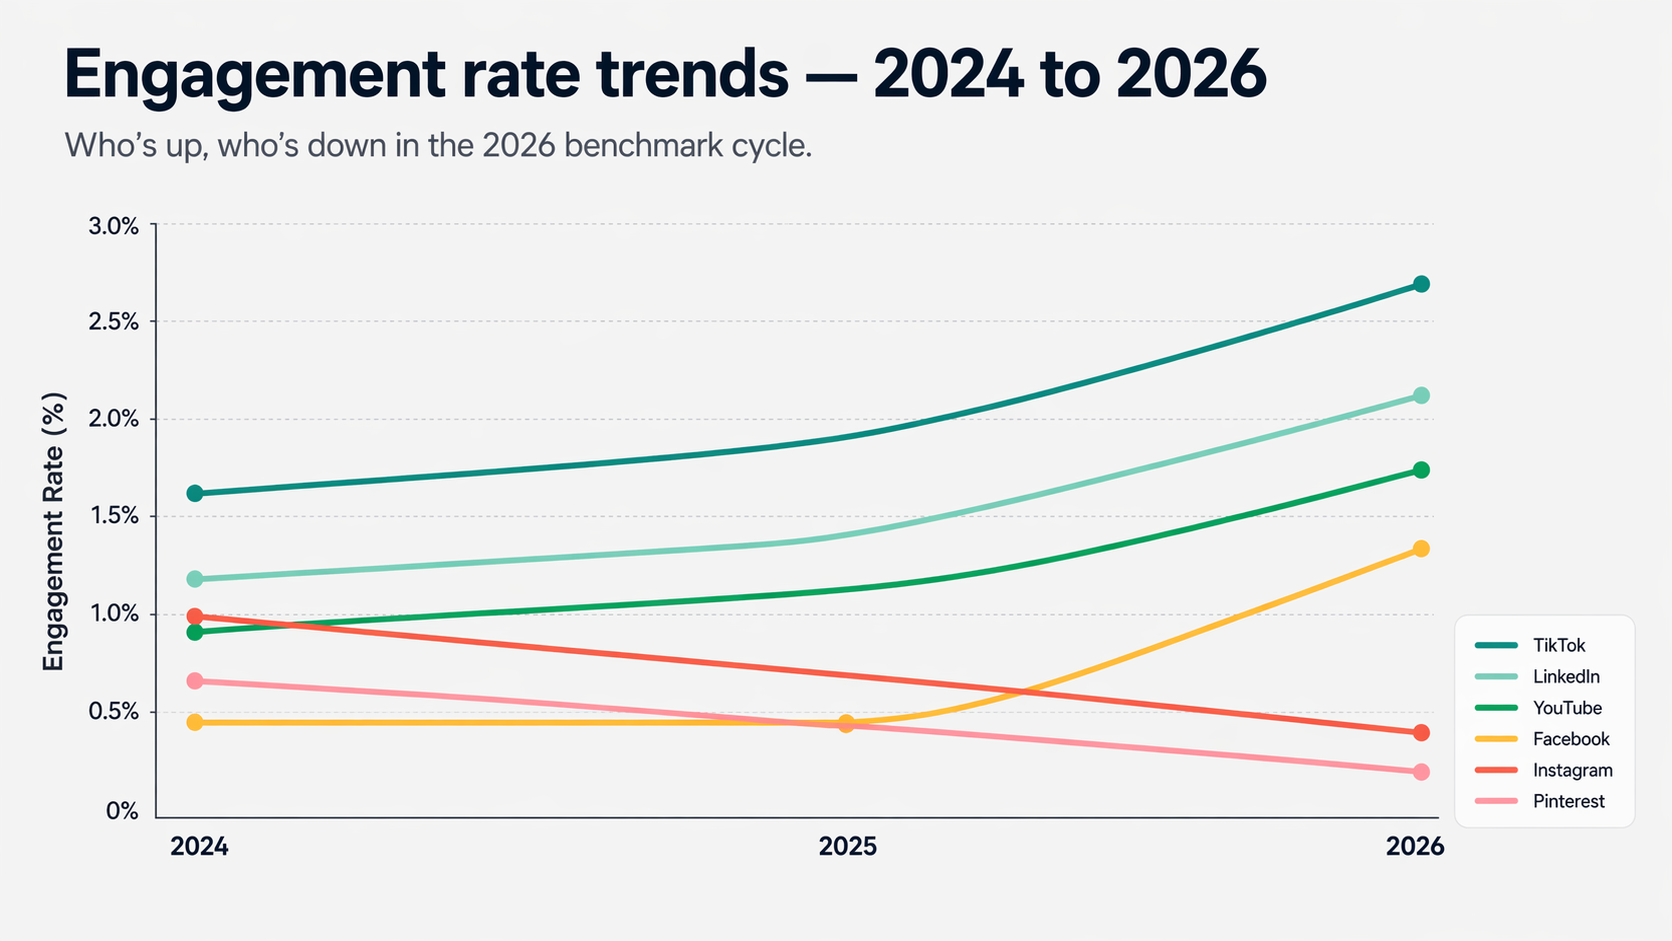
Rising in 2026
| Platform | What's up | Magnitude |
|---|---|---|
| Reach, impressions, interactions | +51% / +57% / +56% | |
| Overall engagement | +14% | |
| X (Twitter) | Engagement rate | +44% |
| TikTok | View-based engagement rate | +9% |
| YouTube | Views, weekly posts, comments | +30% / +25% / +7% |
| Threads | User base, interactions per post | Growing quickly |
Falling in 2026
| Platform | What's down | Magnitude |
|---|---|---|
| Median engagement rate (follower-based) | −17% | |
| Median engagement rate (view-based) | −24% | |
| Reach | −31% | |
| Reels reach | −35% | |
| Likes / comments / shares | −13% / −17% / −10% | |
| Overall engagement | Continued decline |
The two biggest stories of 2026
Facebook's rebound. The platform most pronounced dead has quietly produced the largest YoY reach growth of any channel. For agencies that deprioritized Facebook between 2022 and 2024, this is an opportunity to revisit — ad spend remains highly efficient precisely because competition has thinned.
LinkedIn's "quiet engagement" shift. Overall engagement is up 14%, but likes, comments, and shares are all down double digits. Readers are still consuming — they're just not leaving public signals. This re-prioritizes save rate, click-through, and reply depth as the LinkedIn metrics worth tracking.
Emerging Platforms: Threads, Bluesky, Google Business Profile
Three platforms that didn't exist (or didn't have API access) in prior benchmark reports now show meaningful data for 2026.
Threads engagement benchmarks 2026
| Metric | Value | Source |
|---|---|---|
| Average impressions per post | 1,536 | Metricool 2026 |
| Average interactions per post | ~25 | Metricool 2026 |
| Reply lift vs original post | +42% | Buffer 2026 |
Threads is the highest reply-to-post engagement lift of any platform measured in 2026. For text-heavy brands and creators previously reliant on X, Threads is now a credible second channel — and often the primary. Scheduling support via how to schedule Threads posts.
Bluesky engagement benchmarks 2026
| Metric | Value | Source |
|---|---|---|
| Average interactions per post | 16.38 (raw count) | Metricool 2026 |
| Engagement rate (%) | Not calculable | — |
⚠️ Bluesky's API does not expose impressions or reach data. Any "Bluesky engagement rate" percentage you see cited in 2026 is fabricated — only raw interaction counts can be reported honestly. For scheduling, see how to schedule Bluesky posts.
Google Business Profile
Google Business Profile engagement is tracked as views, direction requests, website clicks, and call clicks rather than a percentage-based engagement rate. Most benchmark reports exclude it for this reason. For scheduling Offers, Updates, and Events across locations, see the PostPlanify Google Business scheduler.
What Counts as a "Good" Engagement Rate in 2026?
This is the single most-asked question about social media benchmarks, and the honest answer is: it depends on the formula, the platform, the industry, and the account size. Here's a defensible tier system.
General engagement rate tiers (by follower, all platforms combined)
| Tier | Engagement rate (by follower) | Interpretation |
|---|---|---|
| Below average | < 0.5% | Content or audience mismatch. Start with format testing. |
| Average | 0.5% – 1% | On par with typical brand accounts. |
| Good | 1% – 3.5% | Above-average performance for most platforms. |
| Excellent | 3.5% – 6% | Top quartile; likely nano/micro-creator or highly engaged niche brand. |
| Elite | 6%+ | Top decile; rare, usually nano or creator accounts. |
Platform-specific tier adjustments (by follower)
| Platform | Good engagement | Excellent | Elite |
|---|---|---|---|
| > 0.30% | > 1% | > 3% | |
| TikTok | > 2% | > 4% | > 8% |
| > 0.05% | > 0.15% | > 0.5% | |
| > 2% | > 5% | > 10% (carousels can exceed 20%) | |
| X | > 0.05% | > 0.25% | > 1% |
Important caveat: these tiers use the follower-based formula because it's the most conservative. If your analytics tool uses reach-based or impression-based, your raw numbers will be larger and these tiers don't apply directly. Always compare like-for-like.
👉 If you want to track engagement across all 10 platforms in one dashboard — without manually converting between formulas — PostPlanify's analytics was built for this. It also surfaces best-time-to-post suggestions based on your actual account data.
How to Calculate Your Own Engagement Rate
Engagement rate math is simple once you know which formula to use. All three are valid — pick the one that matches the benchmark you're comparing against.
Formula 1: Engagement by follower
Engagement Rate = (Total Engagements ÷ Total Followers) × 100
Engagements typically include likes, comments, shares, and saves. Some tools include video views and sticker taps (Stories); some don't. Match the tool's definition to the benchmark source.
Best for: benchmarking against Quid / Rival IQ reports, platform-agnostic comparisons, zero-growth accounts.
Formula 2: Engagement by reach
Engagement Rate = (Total Engagements ÷ Total Reach) × 100
Reach = unique accounts that saw the post at least once. Available in every major platform's native analytics.
Best for: benchmarking against Socialinsider or Sprout, measuring content quality, reporting to clients.
Formula 3: Engagement by impression
Engagement Rate = (Total Engagements ÷ Total Impressions) × 100
Impressions = total times content was served (includes repeat views from the same account).
Best for: benchmarking against Buffer, paid-media reporting, ad analytics.
For a step-by-step walkthrough with worked examples, see our full engagement rate calculator guide.
A faster way: use a calculator
Manually calculating engagement rate across multiple platforms and weeks is tedious. Use one of these:
- Platform-native analytics (Instagram Insights, LinkedIn Analytics, TikTok Business Center, etc.) — free, but siloed per platform.
- Cross-platform analytics tools. PostPlanify calculates all three formulas across every connected account and lets you export white-label PDF reports for clients.
- Socialinsider / Rival IQ for deep competitor benchmarking (enterprise pricing).
How to Improve Your Engagement Rate in 2026
Benchmarks are diagnostic. Improving is the other half of the story. The interventions that moved the needle most consistently across 2025–2026 case studies:
1. Switch formats based on platform data
- LinkedIn: prioritize carousels. 21.77% median engagement vs. ~6% for images.
- Instagram: carousels edge Reels for engagement; Reels still wins for reach. Alternate weekly.
- TikTok: native video only — no cross-posted Reels with watermarks.
- Facebook: Reels + link posts both performing well; static images underperform.
- X: threads and replies outperform original standalone posts.
2. Reply to replies (especially Threads and LinkedIn)
Buffer's 2026 data shows reply engagement lifts of +42% on Threads, +30% on LinkedIn, and +21% on Instagram. A reply costs 30 seconds and measurably increases per-post engagement.
3. Publish more frequently (but on the right platform)
YouTube's +30% view growth came alongside a +25% increase in weekly posts. Frequency still compounds — when the platform rewards it. Facebook and YouTube reward frequency in 2026; Instagram and LinkedIn reward quality over quantity.
4. Use posting-time data, not posting-time guesses
Every platform's algorithm favors early engagement velocity. Posting when your specific audience is online matters more than posting at a generic "best time." See our best time to post on social media guide for platform-specific windows.
5. Use AI to reduce the cost of testing formats
The accounts pulling ahead in 2026 are running more variations faster. PostPlanify's AI assistant generates platform-appropriate variations of a single piece of content — one asset becomes 10 platform-native formats, which compounds into weekly format-testing without a corresponding content budget.
6. Benchmark against your vertical
An average Retail Instagram account hitting 0.22% is outperforming its industry median (Quid 2026). The same rate for a Higher Ed account would be underperforming by a wide margin. Compare within vertical, always.
Methodology & Sources
How we built this article
- Pulled data exclusively from Tier 1 primary sources — vendor-published benchmark reports and original research. No blog-to-blog citations.
- Cross-referenced every number across at least two sources where possible to flag methodological conflicts.
- Labeled the formula used (by follower / by reach / by impression) for every percentage figure.
- Flagged any data older than 24 months as "most recent available."
- Last updated: July 9, 2026 (quarterly update — added PostPlanify first-party benchmarks). We update this page quarterly (January / April / July / October) as new vendor reports publish.
Primary sources cited
- Quid 2026 Social Media Industry Benchmark Report — published March 2026. 18 industries, 4 platforms + YouTube.
- Socialinsider 2026 Social Media Benchmarks — published January 2026. 70M posts analyzed.
- Socialinsider 2026 Instagram Organic Engagement Benchmarks.
- Socialinsider 2026 TikTok Organic Engagement Benchmarks.
- Metricool 2026 Social Media Study — published December 2025. 1.06M accounts, 39.7M posts, all 10 platforms.
- Metricool 2026 LinkedIn Study — published April 2026. 670K posts, 63K accounts.
- Buffer State of Social Media Engagement 2026 — published March 2026. 52M posts across 10 platforms.
- Buffer X, Threads & Bluesky Analysis.
- We Are Social / DataReportal Digital 2026 Mid-Year Global Update — published April 2026. Source for the 5.79B users / 69.9% / +5.4% YoY figures cited in this article.
- Sprout Social 2026 Content Strategy Report.
- Influencer Marketing Hub 2026 Benchmark Report — industry standard for tier-based influencer engagement rates (nano, micro, mid, macro, mega).
- PostPlanify platform data (July 2026) — 14,000+ posts from 580 connected accounts, synced via official platform APIs; per-view engagement medians, posting-frequency growth curves, and consistency rates. First-party; methodology in the first-party benchmarks section.
Methodology caveats worth flagging
- DataReportal "social media user" figures measure user identities, not unique humans. A person with both an Instagram and a TikTok account counts twice.
- Quid is the parent company of Rival IQ (acquired December 2021). The 2026 Social Media Industry Benchmark Report is published at quid.com under the Quid brand; Rival IQ continues to operate as a subsidiary ("Rival IQ, a Quid company") and still independently publishes its own 2025 version of the report.
- Socialinsider publishes multiple benchmark pages with different figures. The platform-specific sub-pages for Instagram (updated Feb 2026) and TikTok (updated April 2026) show sharper YoY changes than the main benchmarks page. Figures cited in this article are from the format-specific sub-pages.
- Bluesky engagement rate as a percentage cannot be calculated because the platform's API does not expose impressions or reach. Only raw interaction counts are valid.
- "Engagement" includes different actions on different platforms. Saves count on Instagram but not on Twitter. Shares count on Facebook but aren't public on LinkedIn. Always check the source's definition before comparing.
All your social media in one simple dashboard
Schedule posts, track analytics, and reply to comments/DMs — without switching tabs.
Engagement
+18%
Views
52.8k
FAQ: Social Media Engagement Rates 2026
What is a good engagement rate on social media in 2026?
A good engagement rate in 2026 depends on the platform and formula used. As a general rule: on Instagram (follower-based), anything above 1% is good, above 3% is excellent. On TikTok (view-based), above 4% is good. On LinkedIn, above 2% is good — and carousels often exceed 20%. On Facebook, the bar is much lower: above 0.05% is average. Always compare within your industry and to the formula your analytics tool uses.
Why do different reports show different engagement rates for the same platform?
Each benchmark publisher uses a different denominator: followers (Quid / Rival IQ), reach or views (Socialinsider), or impressions (Buffer). The same post divided by followers vs. reach vs. impressions produces three different percentages — all technically correct. Before citing any engagement rate figure, confirm which formula it used. Our methodology section above explains the math.
Which platform has the highest engagement rate in 2026?
TikTok has the highest organic engagement rate among major platforms — 4.20% by view (Socialinsider 2026) or 2.01% by follower (Quid 2026). However, in PostPlanify's first-party per-view data (July 2026), Instagram leads at 3.87% median vs TikTok's 1.62% — TikTok's giant non-follower reach deflates its per-view rate. And for specific formats, LinkedIn carousels hit a median 21.77% (Buffer 2026), the single highest format-level engagement rate of any 2026 benchmark dataset.
What is the average engagement rate on Instagram in 2026?
The average Instagram engagement rate in 2026 is 0.30% by follower (Quid 2026, down 17% YoY) or 0.48% by view (Socialinsider 2026, down 24% YoY). Buffer's impression-based figure is 5.46% — valid for its methodology but not comparable to follower-based benchmarks. For small-to-mid-size accounts specifically, PostPlanify's first-party data (152 Instagram accounts, July 2026) puts the median at 3.87% per view — higher than big-brand-weighted medians, consistent with the small-account advantage. Nano-influencers (1K–10K followers) average around 6.23% (Influencer Marketing Hub 2026) — the gap between small and large accounts keeps widening.
What is the average engagement rate on TikTok in 2026?
The median TikTok engagement rate in 2026 is 2.01% for brand accounts (Quid 2026, by follower) or 4.20% overall (Socialinsider 2026, by view) — a 9% year-over-year increase. TikTok remains the only major platform where engagement is still growing in 2026. Small accounts (1K–5K followers) see even higher rates, around 4.40%.
What is the average engagement rate on LinkedIn in 2026?
LinkedIn overall engagement is up 14% year-over-year in 2026 (Metricool LinkedIn Study April 2026), despite likes (−13%), comments (−17%), and shares (−10%) all declining. This is the "quiet engagement" shift — users consume more content but leave fewer public signals. LinkedIn carousel posts median 21.77% engagement (Buffer 2026), and personal profiles average 63% more engagement than Company Pages.
What is the average engagement rate on Facebook in 2026?
Facebook's median engagement rate stays flat at approximately 0.02% by follower (Quid 2026). However, reach is up 51%, impressions up 57%, and total interactions up 56% year-over-year (Metricool 2026) — meaning the same percentage now represents significantly more absolute engagement. Facebook had a reach rebound year in 2026.
What is the average engagement rate on X (Twitter) in 2026?
X's median engagement rate is 0.03% by follower (Quid 2026) or approximately 2.8% by impression (Buffer 2026). X saw its first engagement gain in several years — +44% YoY in Buffer's dataset — driven primarily by replies and thread formats rather than follower-based virality.
How do you calculate engagement rate?
Engagement rate has three valid formulas: (1) by follower: engagements ÷ followers × 100; (2) by reach: engagements ÷ unique accounts reached × 100; (3) by impression: engagements ÷ total impressions × 100. Pick the formula that matches the benchmark source you're comparing against — mixing formulas produces meaningless comparisons. For step-by-step worked examples, see our engagement rate calculator guide.
Why are my engagement rates lower than the benchmarks?
Three most common reasons: (1) your tool uses a different formula than the benchmark source (follower-based rates will always look lower than reach or impression-based rates); (2) you're comparing to an all-industry median but your industry sits below-median (Beauty, Retail, and Financial Services are all below-median in 2026); (3) reach decline, not content quality, is suppressing the number — test by comparing engagement-by-reach instead of engagement-by-follower to isolate algorithm changes from content changes.
Do small accounts have higher engagement rates?
Yes — consistently across every platform, with one floor: PostPlanify's first-party data (July 2026) shows accounts under 1K followers engage below the 1K–10K tier (2.78% vs 4.36% median per view), so the small-account advantage kicks in around 1K followers, not at zero. Above that: nano-influencers (1K–10K) average around 6.23% engagement vs. 1–3% for mega accounts (500K+) (Influencer Marketing Hub 2026), and on TikTok small accounts (1K–5K) hit 4.40% vs. 3.75% for mid-tier (Socialinsider 2026). Small-account intimacy, algorithmic favoritism toward fresh accounts, and follower activeness all contribute.
What content formats have the highest engagement in 2026?
LinkedIn document / carousel posts have the single highest format-level engagement in 2026 at 21.77% median (Buffer 2026) — roughly 3× LinkedIn's video and image formats. On Instagram, carousels (0.55%) edge Reels (0.52%) and static images (0.37%). On TikTok, native (non-cross-posted) video is the dominant format. Across platforms, replies and comments outperform original posts by 21–42% (Buffer 2026).
Are engagement rates going up or down in 2026?
Mixed. Up on TikTok (+9%), LinkedIn (+14% overall), X (+44% via Buffer), and YouTube (views +30%). Down on Instagram (−17% follower-based, −24% view-based), Instagram reach (−31%), and Pinterest. Facebook is flat on engagement rate but up on reach (+51%), impressions (+57%), and total interactions (+56%).
Which industries have the highest engagement rates?
The top-performing industries in Quid's 2026 report are Higher Education, Sports Teams, Influencers, and Energy / Pharma. Below-median industries include Beauty, Fashion / Retail, Financial Services, and Tech / Software. Industry benchmarks matter more than platform medians — compare within vertical to avoid misleading conclusions.
Is engagement rate the right metric to track?
It depends on the goal. Engagement rate is useful for comparing content performance over time on a stable account, benchmarking against industry medians, and reporting format/campaign effectiveness. It's less useful for measuring revenue impact (use attribution + click-through instead) or for channels like Pinterest and YouTube where engagement is structurally different (saves, watch time, subscriptions). Pair engagement rate with reach, click-through rate, and conversion metrics for a full picture — see our guide on how to measure social media ROI.
What is the difference between reach, impressions, and engagement?
Reach = unique accounts that saw the post (each person counted once). Impressions = total times the post was served (counts repeat views from the same account). Engagement = actions taken on the post: likes, comments, shares, saves, clicks. Impressions are always ≥ reach. Engagement is always a subset of either. For a detailed breakdown, see our social media impressions guide.
How can I improve my engagement rate?
Six interventions that measurably move the needle in 2026: (1) switch to format winners — LinkedIn carousels, Instagram carousels, TikTok native video; (2) reply to replies, especially on Threads, LinkedIn, and Instagram; (3) increase frequency on platforms that reward it (YouTube, Facebook); (4) post when your specific audience is active, not at generic "best times"; (5) use AI tools to cheaply generate platform-native variations; (6) benchmark against your industry, not the all-industry median. See how to grow Instagram followers organically for deeper tactics.
What is the engagement rate on Threads and Bluesky?
Threads averages approximately 25 interactions per post on 1,536 average impressions (Metricool 2026) — translating to roughly a 1.6% engagement rate on that formula. Bluesky averages 16.38 interactions per post (Metricool 2026), but its API does not expose impression or reach data — any Bluesky engagement rate percentage you see cited is unreliable. Only raw interaction counts are valid for Bluesky in 2026.
Final Thoughts + Quick Benchmark Checklist
If you've scrolled this far, the actual practical takeaway is this: the benchmark number matters less than the formula behind it. Three sources reporting three different numbers for Instagram aren't contradicting each other — they're measuring three different things. Your job as a marketer, founder, or agency lead is to pick the formula that matches your reporting cadence and compare like-for-like from there.
Use this checklist before citing or acting on any engagement rate benchmark:
- ✅ Do I know which formula the benchmark used (follower / reach / impression)?
- ✅ Am I comparing to the same formula in my own analytics?
- ✅ Am I benchmarking within my industry vertical, not all-industry median?
- ✅ Am I adjusting for account size (nano, micro, mid, macro, mega)?
- ✅ Is the benchmark from 2025 or 2026, not older data dressed up as current?
- ✅ Did the source disclose sample size and methodology?
- ✅ Am I tracking the metric consistently month-over-month, or switching formulas mid-report?
If you're running benchmarks across multiple clients or multiple platforms, a single cross-platform dashboard is the only way to stay sane.
Try PostPlanify free for 7 days — cross-platform engagement analytics, AI-powered content variations, and white-label PDF reports for agencies, all in one dashboard. Covers all 10 platforms we benchmarked in this article.
Also read: Social Media Analytics and Reporting — the companion guide on turning engagement data into actionable insights.
Related: Engagement Rate Calculator Guide | Social Media Analytics for Business | How to Measure Social Media ROI | Best Time to Post on Social Media | Social Media Impressions Explained | How to Grow Instagram Followers Organically | Instagram Reels Algorithm | Instagram Carousel Guide | How to Plan Social Media Content | Social Media Best Practices | Social Media Analytics and Reporting | Social Media Content Calendar Examples
All your social media in one simple dashboard
Schedule posts, track analytics, and reply to comments/DMs — without switching tabs.
Engagement
+18%
Views
52.8k
About the Author

Hasan Cagli
Founder of PostPlanify, a content and social media scheduling platform. He focuses on building systems that help businesses, agencies, and teams plan, publish, and manage content and social media more efficiently across platforms.


