
You open Instagram Insights, see reach, impressions, accounts engaged, follower activity, and a stack of post-level charts, then still end up with the same question: what should I do next?
This is the core problem with instagram business account analytics. Many teams don't lack data. They lack a way to turn that data into decisions. A Reel gets views but no profile visits. A carousel gets fewer views but more saves. Follower count goes up while website taps stay flat. Nothing looks obviously broken, but nothing clearly connects to business results either.
This gets worse when you're managing more than one account. One brand cares about DMs. Another needs product-tagged sales. A third only wants to know whether content is building awareness in the right market. Native Instagram charts help, but they don't tell the full story unless someone interprets them properly and reports them consistently.
The useful shift is simple. Stop reading Instagram analytics like a scoreboard. Start reading them like behavior signals.
Quick Answer: How to Use Instagram Business Account Analytics
Instagram business account analytics are performance insights — reach, impressions, engagement, profile visits, website taps, follower demographics, and content-level data — that are available to Business or Creator accounts through the Professional Dashboard. The fastest way to get value from them:
- Switch to a Professional account (Settings → Account type → Switch to professional).
- Open the Professional Dashboard → Insights to see reach, engagement, audience, and content performance.
- Pick KPIs by business goal — awareness (reach, profile visits), engagement (saves, shares, replies), or conversion (website taps, DMs, product-tag interactions).
- Read trends, not snapshots. Native Insights only retains 90 days of audience-level data — use a dedicated analytics tool for long-range comparisons.
- Report monthly with one template: what changed, why, what to do next.
Native Instagram analytics are good for individual posts and weekly checks. For multi-account reporting, year-over-year comparisons, or client portfolios, a centralized analytics tool like PostPlanify makes the difference.
When you do that, metrics become easier to use. Reach tells you whether Instagram is distributing your content. Saves tell you whether people see long-term value in it. Profile visits show whether content creates curiosity. Website taps and DMs tell you whether interest is turning into action. Follower trends show whether your content mix is building an audience that wants more, not just reacting once.
Practical rule: If a metric doesn't change your next content, publishing, or reporting decision, it isn't useful yet.
A good analytics workflow doesn't start with dashboards. It starts with questions. Which content format moves people from passive viewing to intent? Which posts attract the right audience, not just the biggest one? Which reports help a client or internal stakeholder understand what to repeat next month?
That's where this guide stays focused. Not on vanity metrics. On how to use Instagram's own data for business decisions, and how to scale that process when one account turns into several.
All your social media in one simple dashboard
Schedule posts, track analytics, and reply to comments/DMs — without switching tabs.

Engagement
+18%
Views
52.8k
What Are Instagram Business Account Analytics?
A common scenario looks like this. You check Insights after posting all week, notice one Reel reached more people than everything else, one carousel earned the most saves, and Stories drove a few replies. Then your manager or client asks what it means. Suddenly the numbers feel less like answers and more like loose parts.
That confusion usually comes from treating every metric as equally important. It isn't. Some metrics describe visibility. Some measure interest. Others point to purchase intent or community strength. If you put them all in the same mental bucket, reporting gets noisy fast.
Instagram also encourages surface-level reading. It's easy to celebrate a post because it "did well" without asking what kind of result it produced. A post can reach a lot of people and still fail to move the business forward. Another can look smaller on the surface but bring better audience quality, more profile visits, or more qualified conversations.
That's why instagram business account analytics work best when you read them in sequence.
Start with distribution. Did people see the content? Then move to response. Did they interact in a meaningful way? Then move to action. Did they visit the profile, tap the link, send a message, or engage with a product tag? Once you report in that order, the story gets clearer.
For solo operators, this helps remove guesswork. For in-house teams, it creates cleaner internal reporting. For agencies, it's the difference between sending clients screenshots and sending analysis.
The primary value of Instagram analytics isn't that they show you what happened. It's that they tell you what to test next.
Match Your Business Goal to the Right Instagram Metrics
Not every metric matters for every account. Use this table to identify which Instagram metrics actually map to your business outcome — and which ones to deprioritize.
| Business Goal | Primary KPIs | Supporting Signals | Skip / Deprioritize |
|---|---|---|---|
| Brand awareness | Reach, follower growth quality | Profile visits, share rate | Likes alone |
| Audience engagement | Engagement rate, saves, shares | Story replies, comments | Total impressions only |
| Lead generation | Qualified DMs, profile visits | Story link taps, sticker taps | Likes on promo posts |
| Website traffic | Website taps, link clicks | Profile visits, story link interactions | Raw reach |
| Sales / e-commerce | Product-tag interactions, website taps | DM conversations, saves on product posts | Follower count alone |
| Community / retention | Story replies, DM conversations | Saves, shares, comment depth | Reach spikes |
| Influencer / creator growth | Follower quality, engagement rate | Profile visits, save rate | Vanity follower count |
Once your goal column is locked, you can ignore most of what's in Insights. That's the point of a KPI — most of the dashboard becomes context, not decisions.
Understanding Instagram Analytics for Business Growth
Instagram analytics matter because publishing without measurement usually leads to two bad habits. Teams either chase whatever got the most views last week, or they keep posting the same things without knowing whether those posts support an actual business goal.
Analytics are a feedback loop
The practical use of analytics is straightforward:
- Publish content with a reason
- Measure how people responded
- Find patterns by format, topic, and timing
- Adjust the next round of content
That loop is what turns content from activity into strategy.
If you run an e-commerce brand, your Instagram data shouldn't just answer "did people like this?" It should help answer whether your content attracts attention, builds trust, and moves people toward action. If you manage clients, analytics should show whether your output is driving awareness, engagement, or conversion behavior in the way each client finds important.
A useful mental model comes from the analytics maturity model for e-commerce. The same logic applies to Instagram. Early-stage reporting focuses on isolated metrics. Mature reporting connects those metrics to decisions, workflows, and revenue outcomes.
You need the right account type first
It is essential to understand that Instagram Insights are only available on professional accounts, which means Business or Creator accounts.
The trade-off is simple:
- Personal account: fine for casual use, poor for analysis
- Creator account: useful for influencers and individuals building an audience
- Business account: better fit for brands, teams, stores, and service businesses that need structured reporting
For most companies, the business setup is the right baseline because it supports more formal measurement and fits better with broader social reporting.
If you're still deciding what to track beyond Instagram alone, this social media analytics for business guide is a useful companion because it frames reporting across channels instead of treating Instagram as a silo.
What analytics should help you answer
A business account's analytics should make these questions easier:
- Audience fit: Are the right people seeing and engaging with the content?
- Content fit: Which formats and topics create meaningful response?
- Timing fit: When is the audience most responsive?
- Business fit: Which content leads to profile visits, clicks, messages, or sales signals?
If your reporting only tells you which post got the most likes, you're measuring output, not progress.
The point isn't to collect more numbers. It's to build a system where each number has a job.
How to Access Your Instagram Analytics Data
It is known that Instagram has Insights, but many reporting problems stem from a basic issue: users are looking in the wrong place, using the wrong account type, or assuming Instagram keeps more history than it provides.

Where to find Insights in the app
If your account is already set up as a professional profile, the path is simple:
- Open your Instagram profile
- Tap Professional dashboard
- Open Insights
From there, Instagram organizes analytics into broad views that cover account performance, audience activity, and content performance.
If your Instagram setup is tied into Meta assets and permissions, this walkthrough on how to link Facebook and Instagram helps clean up a lot of access issues before they turn into reporting problems.
What the native dashboard includes
The native Insights experience is most useful when you know what each area is for.
Overview
This is your short-range pulse check. It aggregates top-level metrics such as accounts reached, accounts engaged, and total followers. It's useful for spotting sudden changes, campaign lift, or weak posting weeks.
Audience
You examine follower growth and audience makeup. It helps answer whether the account is attracting the right people and whether active-time patterns line up with your publishing schedule.
Content
This area is usually where the most practical decisions come from. You can compare posts, Stories, and Reels and look for repeated winners by format, topic, or call to action.
A quick visual walkthrough helps if you want to see the in-app flow before setting up your reporting process:
The retention limit most teams run into
Instagram's native dashboard is helpful, but it has an important limitation. Overview and Audience data are limited to the last 90 days, while Content data for individual Posts, Stories, and Reels can be retained for up to 2 years, according to Improvado's breakdown of Instagram analytics retention.
That creates a real reporting problem. You can still inspect older content items, but long-term audience and account-level trend analysis gets much harder if you rely only on the app.
Operational note: Native Insights are good for weekly and monthly checks. They're weak for long-range reporting, year-over-year comparisons, and client portfolio analysis.
That's usually the point where teams start exporting screenshots, copying numbers into spreadsheets, or pulling data through external systems.
Native Insights vs Meta Business Suite vs PostPlanify
If you're trying to decide where to do your reporting, here's a side-by-side of how the three main options compare for an Instagram business account.
| Capability | Native Instagram Insights | Meta Business Suite | PostPlanify |
|---|---|---|---|
| Account-level data retention | 90 days | 90 days | Full historical (custom date ranges) |
| Post-level data retention | 2 years | 2 years | Full historical |
| Multi-account dashboard | No | Limited (Meta-owned only) | Yes (10 platforms) |
| Custom date ranges | Limited | Limited | Yes |
| Cross-platform analytics | No | Facebook + Instagram only | Instagram, X, Facebook, TikTok, YouTube, LinkedIn, Threads, Pinterest, Bluesky, Google Business |
| Best time to post suggestions | No (manual) | No | Yes (per-account, audience-based) |
| White-label PDF reports | No | No | Yes (Scale plan) |
| Approval workflows | No | Limited | Yes (Premium+) |
| Team collaboration | No | Limited | Yes (3–12 members by plan) |
| Cost | Free | Free | Starts at $79/mo (billed yearly) |
Native Insights is the right starting point for one account and a casual cadence. Meta Business Suite makes sense if you only run Facebook and Instagram together. Beyond that — multiple brands, longer history, exportable reports, or any platform Meta doesn't own — a dedicated analytics tool covers the gaps.
Why third-party tools can see more usable history
External social analytics platforms don't magically invent extra Instagram data. They access approved data through Meta's platform connections and store it in a way that's easier to compare over time.
That matters when you need to answer questions like:
- Did follower growth improve after we changed the content mix?
- Which client accounts respond best to carousels versus Reels?
- Are profile visits rising even when total reach is flat?
- Did campaign performance change after a handoff to a new team member?
The main takeaway is practical. Use native Insights for immediate decisions. Use a structured reporting system when you need continuity, comparisons, and clean history.
A Complete Guide to Key Instagram Metrics
A weekly Instagram report often looks healthy at first glance. Reach is up, a Reel pulled strong views, and follower count ticked upward. Then the harder question comes in from a client, director, or account lead: what changed in the business because of that performance?
That question is what separates vanity reporting from useful reporting. The metrics below matter because each one should change a content decision, a publishing choice, or a conversion hypothesis. If you manage one brand, that helps you prioritize. If you manage ten or fifty accounts, it becomes the only way to report at scale without drowning in disconnected screenshots and post-by-post commentary.

Reach
What it is: The number of unique accounts that saw your content.
Why it matters: Reach is the cleanest awareness metric inside Instagram. It shows how far distribution spread beyond your existing audience or repeated exposure to the same users.
What to look for: Review reach by content type, not just by post. If Reels consistently expand reach but carousels drive stronger intent, both formats are doing different jobs. Across a client portfolio, that distinction prevents a common reporting mistake: pushing every account toward the format that gets the widest distribution instead of the format that supports the actual goal.
Pro Tip: A Sprout Social analysis of 2.7 billion engagements across 463,000 profiles found that posts published Tuesday–Thursday between 11 AM and 6 PM earned the highest median reach. But cadence beats timing — accounts that post 3–5 times a week consistently outperform accounts that post inconsistently at "perfect" times. See our best time to post on Instagram guide for the full breakdown by industry.
Impressions
What it is: The total number of times your content appeared on screen.
Why it matters: Impressions add frequency. They show whether Instagram served the content repeatedly to the same audience, which can signal either strong resonance or narrow distribution.
What to look for: A high impressions-to-reach ratio is not automatically positive. For a product launch or offer reminder, repeated exposure can help. For awareness campaigns, it may mean the post did not break out to enough new people. If your team needs a cleaner reporting distinction, use this views vs impressions breakdown as a reference point.
Engagement rate
What it is: A ratio that compares interactions to either reach, impressions, or follower count, depending on your reporting method.
Why it matters: Engagement rate is useful for comparison. It helps normalize performance between posts that had very different distribution levels, and it is one of the few ways to compare accounts of different sizes with some discipline.
What to look for: Pick one formula and stick to it across every report. I usually recommend reach-based engagement rate for content analysis because it answers a practical question: of the people who saw this post, how many reacted? Follower-based engagement rate can still work for executive summaries, but it gets less useful when you compare small and large accounts in the same dashboard.
Saves
What it is: The number of times users saved a post to revisit later.
Why it matters: Saves usually signal utility, not just interest. Educational carousels, how-to Reels, checklists, product comparisons, and process breakdowns tend to earn them because people expect to come back and use the content.
What to look for: High saves with average reach often point to content worth repurposing. For agencies, this is one of the easiest ways to identify repeatable formats across accounts. A post that gets saved heavily in one niche often deserves a variant test in another, even if the visual execution changes. If carousels are your best save-driver, our Instagram carousel guide covers structure and slide-count best practices.
Profile visits
What it is: The number of users who tapped through to your profile after seeing content.
Why it matters: Profile visits sit in the middle of the funnel. They show that the post created enough curiosity or trust for someone to check who you are, what you sell, or whether the account is worth following.
What to look for: Track profile visits against reach and against follows. If content generates attention but few profile visits, it may be entertaining without building brand interest. If profile visits are healthy but follows stay flat, the issue often sits in profile positioning, pinned posts, bio clarity, or content consistency.
Website taps
What it is: Clicks from your Instagram profile link and related account entry points.
Why it matters: Website taps are one of the closest organic Instagram gets to business action inside native reporting. They are not sales, but they are a strong intent signal, especially for service businesses, SaaS brands, publishers, and e-commerce accounts using Instagram to drive traffic.
What to look for: Compare website taps with profile visits. A large gap usually points to friction after the click-through to the profile. The bio may be vague, the offer may be weak, or the landing page may not match the content promise. In portfolio reporting, this metric becomes more useful when you standardize naming conventions for campaigns so you can tie traffic spikes back to specific content themes.
Follower growth
What it is: Net change in followers over a selected period.
Why it matters: Follower growth shows whether attention compounds. It helps answer whether content is building a subscribable audience rather than producing isolated spikes.
What to look for: Read growth with engagement quality. Fast growth with weak saves, low comments, and minimal profile action can mean low-fit audience acquisition. Slower growth with strong interaction and repeat profile activity is often healthier, especially for local brands, B2B companies, and niche service providers.
Story metrics
Stories need a separate read because user behavior is different there. Feed posts and Reels are discovery surfaces. Stories are closer to retention, relationship, and conversion support.
Key story signals include:
- Exits: People left the Story sequence
- Taps forward: People skipped to the next frame
- Replies: Direct audience response
- Sticker taps or link taps: Action taken inside the Story
Look at these as pattern signals, not isolated judgments. One high-exit frame is not a crisis. Repeated exits on offer slides, talking-head clips, or dense text frames usually point to a creative problem you can fix. Replies and sticker taps often matter more than raw story views because they show active participation from the audience you already have.
Follower demographics and active times
What it is: Audience data such as location, age range, gender split, and the times followers are most active.
Why it matters: Audience fit changes how every other metric should be interpreted. Ten thousand views from the wrong region or the wrong buyer segment can be less useful than two thousand views from the right audience.
What to look for: Use demographics to check whether content attracts the people the business wants to reach. Use active times as a testing input, not a fixed rule — your audience's behavior often diverges from generic best time to post averages. For teams managing multiple Instagram accounts, this is also where native analytics start to slow down. Comparing audience shifts account by account inside Instagram is possible, but reporting it cleanly across a portfolio is tedious. A centralized tool such as PostPlanify helps by storing those patterns in one reporting workflow instead of scattering them across individual account views.
If your Instagram program also includes creator campaigns, this guide to proving influencer ROI is useful for connecting content performance to commercial outcomes rather than stopping at surface engagement.
All your social media in one simple dashboard
Schedule posts, track analytics, and reply to comments/DMs — without switching tabs.
Engagement
+18%
Views
52.8k
How to Set KPIs from Your Instagram Analytics
A metric is a number. A KPI is a number tied to a business outcome.
That distinction sounds obvious, but a lot of Instagram reporting breaks down right there. Teams track likes, views, and followers because those numbers are visible. They never decide which of those numbers should count as success.
Start with the business goal, not the dashboard
Use this simple rule: pick the business objective first, then assign the Instagram metrics that best reflect progress toward it.
Here's a practical mapping:
-
Brand awareness
- Better KPI choices: reach, profile visits, follower growth
- Bad KPI choice: comments alone
-
Audience engagement
- Better KPI choices: engagement rate, saves, shares, replies
- Bad KPI choice: total impressions without interaction
-
Traffic
- Better KPI choices: website taps, profile visits, story link interactions
- Bad KPI choice: raw reach with no click behavior
-
Lead generation
- Better KPI choices: qualified DM conversations, profile visits from service content
- Bad KPI choice: likes on promotional posts
-
Sales support
- Better KPI choices: product-tag engagement, website taps, DM conversations tied to buying intent
- Bad KPI choice: follower count growth on its own
Use revenue-linked signals where Instagram gives them to you
Some Instagram actions are closer to business outcomes than others. According to Meta, businesses that use Instagram Direct Messages to engage with local customers see a conversion rate as high as 70%, and posts with product tags generate 37% higher sales on average, as summarized in this Instagram stats report.
That matters because it changes how you report.
If you're a local service business, DMs aren't just engagement. They can be a lead-generation KPI.
If you're an e-commerce brand, product-tag interaction shouldn't sit in a "nice to know" category. It belongs in your sales-support reporting.
Reporting rule: The closer a metric is to action, the more weight it should carry in your KPI set.
Build KPI groups, not one giant dashboard
A cleaner monthly report usually has no more than three KPI groups:
Visibility KPIs
Use these when the current priority is awareness or market entry.
Track:
- Reach
- Profile visits
- Follower growth trend
Engagement KPIs
Use these when the priority is community, education, or content quality.
Track:
- Engagement rate
- Saves
- Shares
- Story replies
Conversion-intent KPIs
Use these when the priority is leads or revenue support.
Track:
- Website taps
- Qualified DMs
- Product-tag interactions
This is also where ROI language needs discipline. Don't say Instagram is "driving ROI" just because one post got attention. Tie it to measurable action and compare that action to a stated objective. If you need a broader framework for that, this guide on ROI on social media is useful for building reports that stakeholders can trust.
A practical KPI setup example
For a local med spa, a smart KPI set might look like this:
- Primary KPI: qualified DMs
- Supporting KPI: profile visits
- Context metric: reach
For a product-led skincare brand:
- Primary KPI: website taps from product education content
- Supporting KPI: saves on routines and ingredient posts
- Context metric: follower growth
For an agency client who wants "more engagement":
Don't stop there. Translate that vague request into measurable behavior. Does "engagement" mean more comments, more saves, more DMs, or stronger story interaction? Until that's defined, reporting will stay fuzzy.
Reporting Templates and Industry Benchmarks
A report usually breaks down at the same moment a stakeholder asks, "Are these results strong, or are we just busy?" If the answer is a screenshot dump or a raw export from Instagram Insights, the team still has work to do.
Benchmarks help, but only if they are used carefully. A small local business, a national ecommerce brand, and an agency client with multiple regional accounts should not be judged against the same baseline. Follower count changes expected engagement. Content mix changes expected reach. Sales cycle changes what counts as a meaningful action.
Engagement benchmarks by follower count
Earlier benchmark data in this article showed a familiar pattern. Smaller accounts usually post higher engagement rates, while larger accounts tend to trade relative engagement for broader reach. That matters because a 0.6% engagement rate can be weak for one account and perfectly healthy for another.
| Instagram Engagement Rate Benchmarks (2026) | Average Engagement Rate |
|---|---|
| Under 10,000 followers | 0.98% |
| 10,000 to 100,000 followers | 0.68% |
| Over 100,000 followers | 0.57% |
| Overall average | 0.45% |
Use benchmark tables as a starting point, not a verdict.
In practice, the better comparison is usually against the account's own trailing performance. I look at the past 3 to 6 months first, then compare that trend against account size, content format, posting cadence, and business model. For agencies, this matters even more. One client may need saves and shares from educational content, while another needs profile visits that lead to qualified DMs. A portfolio report gets stronger when each account is judged against the right peer group and its own recent baseline.
What a useful monthly report should include
A monthly report should answer three questions clearly:
- What changed?
- Why did it probably change?
- What should the team do next?
That sounds simple, but it removes a lot of bad reporting habits. Vanity metrics get less room. Screenshots stop carrying the whole story. Recommendations become easier to defend.
1. Executive summary
Keep this tight. One short paragraph usually does the job.
Include:
- the most important positive result
- the main risk or weak spot
- one action to carry into the next month
For client work, I also add a sentence on business relevance. If reach grew but qualified traffic did not, say that plainly. If fewer posts produced better saves and more profile actions, that is a useful efficiency gain.
2. Trend view across the month
Month-end totals hide too much. Trend lines show whether a spike came from one Reel, one promotion, a content shift, or steady improvement.
Track movement for:
- follower growth
- reach
- engagement trend
- profile visits
- website taps or DMs, when those actions matter to the account
This is also where single-account reporting starts to hit limits. If an agency is reviewing ten client accounts by hand, trend analysis gets slow fast. A shared reporting system makes it easier to compare month-over-month movement across the full portfolio without rebuilding the same chart every cycle.
3. Top-performing content with interpretation
Ranking posts is not enough. Explain why they worked.
For each strong post, Story sequence, or Reel, add:
- the format
- the topic or hook
- the metric it moved most
- the likely reason it performed well
A practical example: a carousel may reach fewer people than a Reel but still be the better business asset if it drives saves, profile visits, and product-page taps. That distinction is what turns Instagram analytics into reporting that a client or leadership team can use.
4. Underperforming content review
Weak posts deserve the same level of analysis as strong ones.
Review:
- opening hook strength
- timing
- format fit
- call to action clarity
- audience-topic match
The goal is not to defend poor performance. The goal is to document what likely held the post back and prevent the same mistake next month.
5. Next-month actions
Close the report with a short action list tied directly to the findings.
Example:
- Publish more educational carousels on the topic that drove the highest saves.
- Cut back low-response promotional Stories.
- Test stronger profile calls to action on high-reach Reels.
- Standardize reporting fields across accounts so client comparisons stay consistent.
That last point matters for teams managing more than one Instagram business account. A template is not just a formatting tool. It is how agencies and in-house teams keep definitions consistent across brands, regions, or client portfolios. If one account reports "engagement" as likes and comments while another includes saves and shares, cross-account analysis becomes unreliable.
If you need a cleaner structure for that process, this guide on how to create a social media report is a practical framework for turning Instagram metrics into stakeholder-ready reporting.
How to Manage Analytics for Multiple Instagram Accounts
Monday morning usually exposes the problem.
One client wants a monthly summary by noon. Another wants a Reel performance breakdown by market. Your team is still switching between Instagram logins, copying numbers into separate spreadsheets, and trying to remember whether each account defines engagement the same way. The issue is not access to data. The issue is turning scattered account-level data into one reporting system that a team can trust.
Single-account reporting can stay inside Instagram for a while. Portfolio reporting usually cannot. Agencies, franchise groups, and in-house teams with regional brands need a shared view of performance, naming conventions, date ranges, and KPI definitions. Without that structure, cross-account analysis turns into a manual admin task instead of a decision-making tool.
The main scaling problem is fragmentation
Fragmentation slows down reporting and weakens the quality of recommendations.
One account may track engagement as likes, comments, saves, and shares. Another may only report likes and comments. One manager exports weekly. Another checks Insights manually at month end. By the time the report reaches a client or leadership team, the numbers are harder to compare and the explanation takes longer than the analysis.

What changes when reporting is centralized
Centralized reporting improves two things first. Speed and consistency.
Instead of reviewing each account in isolation, teams can compare performance across a group of accounts using the same filters and definitions. That changes the questions you can answer. Which brand gets the strongest save rate on educational carousels? Which region generates profile visits but weak website taps? Which client is growing reach because of content quality, and which one is only posting more often?
Those comparisons are hard to do well inside native tools alone. A platform such as PostPlanify gives teams one place to plan, publish, and review analytics across multiple social accounts, including Instagram. The practical gain is not just convenience. It is fewer reporting errors, faster monthly closeouts, and a cleaner view of patterns across a client portfolio.
What works better than native-only reporting
Native Insights still has a role. It is useful for quick post checks, audience snapshots, and validating performance inside an individual account. It becomes limiting when a team needs historical comparisons, standardized exports, or side-by-side reporting across ten, twenty, or fifty accounts.
These workflows hold up better at scale:
Use one shared KPI definition set
Set definitions before building dashboards.
If engagement includes saves and shares for one account, it should include saves and shares for all accounts using that same reporting template. The same rule applies to reach windows, conversion events, and content labels. This is what makes cross-account reporting credible.
Group accounts by business objective
A local clinic, an ecommerce brand, and a franchise location should not be benchmarked against the same primary metric set. Group accounts by goal first. Lead generation accounts should be judged on profile actions and traffic quality. Brand awareness accounts should be judged more heavily on reach, share rate, and audience growth quality.
That trade-off matters. Standardization keeps reports clean, but over-standardization can hide the actual job each account is supposed to do.
Keep historical data outside Instagram
Instagram is not built to act as your long-term reporting archive.
Store monthly snapshots, campaign notes, and KPI summaries in a system your team can revisit later. That historical record makes quarterly reviews much easier, especially when a client asks why performance changed six months ago or whether a format trend is sustained or temporary.
Build one reporting template, then customize the narrative
The reporting structure should stay stable even when the insight changes by account.
Use the same sections each month: KPI summary, top content, content pattern shifts, audience changes, conversion signals, and actions. Then adjust the commentary based on the account's goal and context. This saves time and makes account manager handoffs much easier.
For agencies, this is also an operations issue. Better analytics management reduces rework, cuts down on clarification rounds, and gives strategists more time to explain what to do next instead of cleaning up reporting inconsistencies.
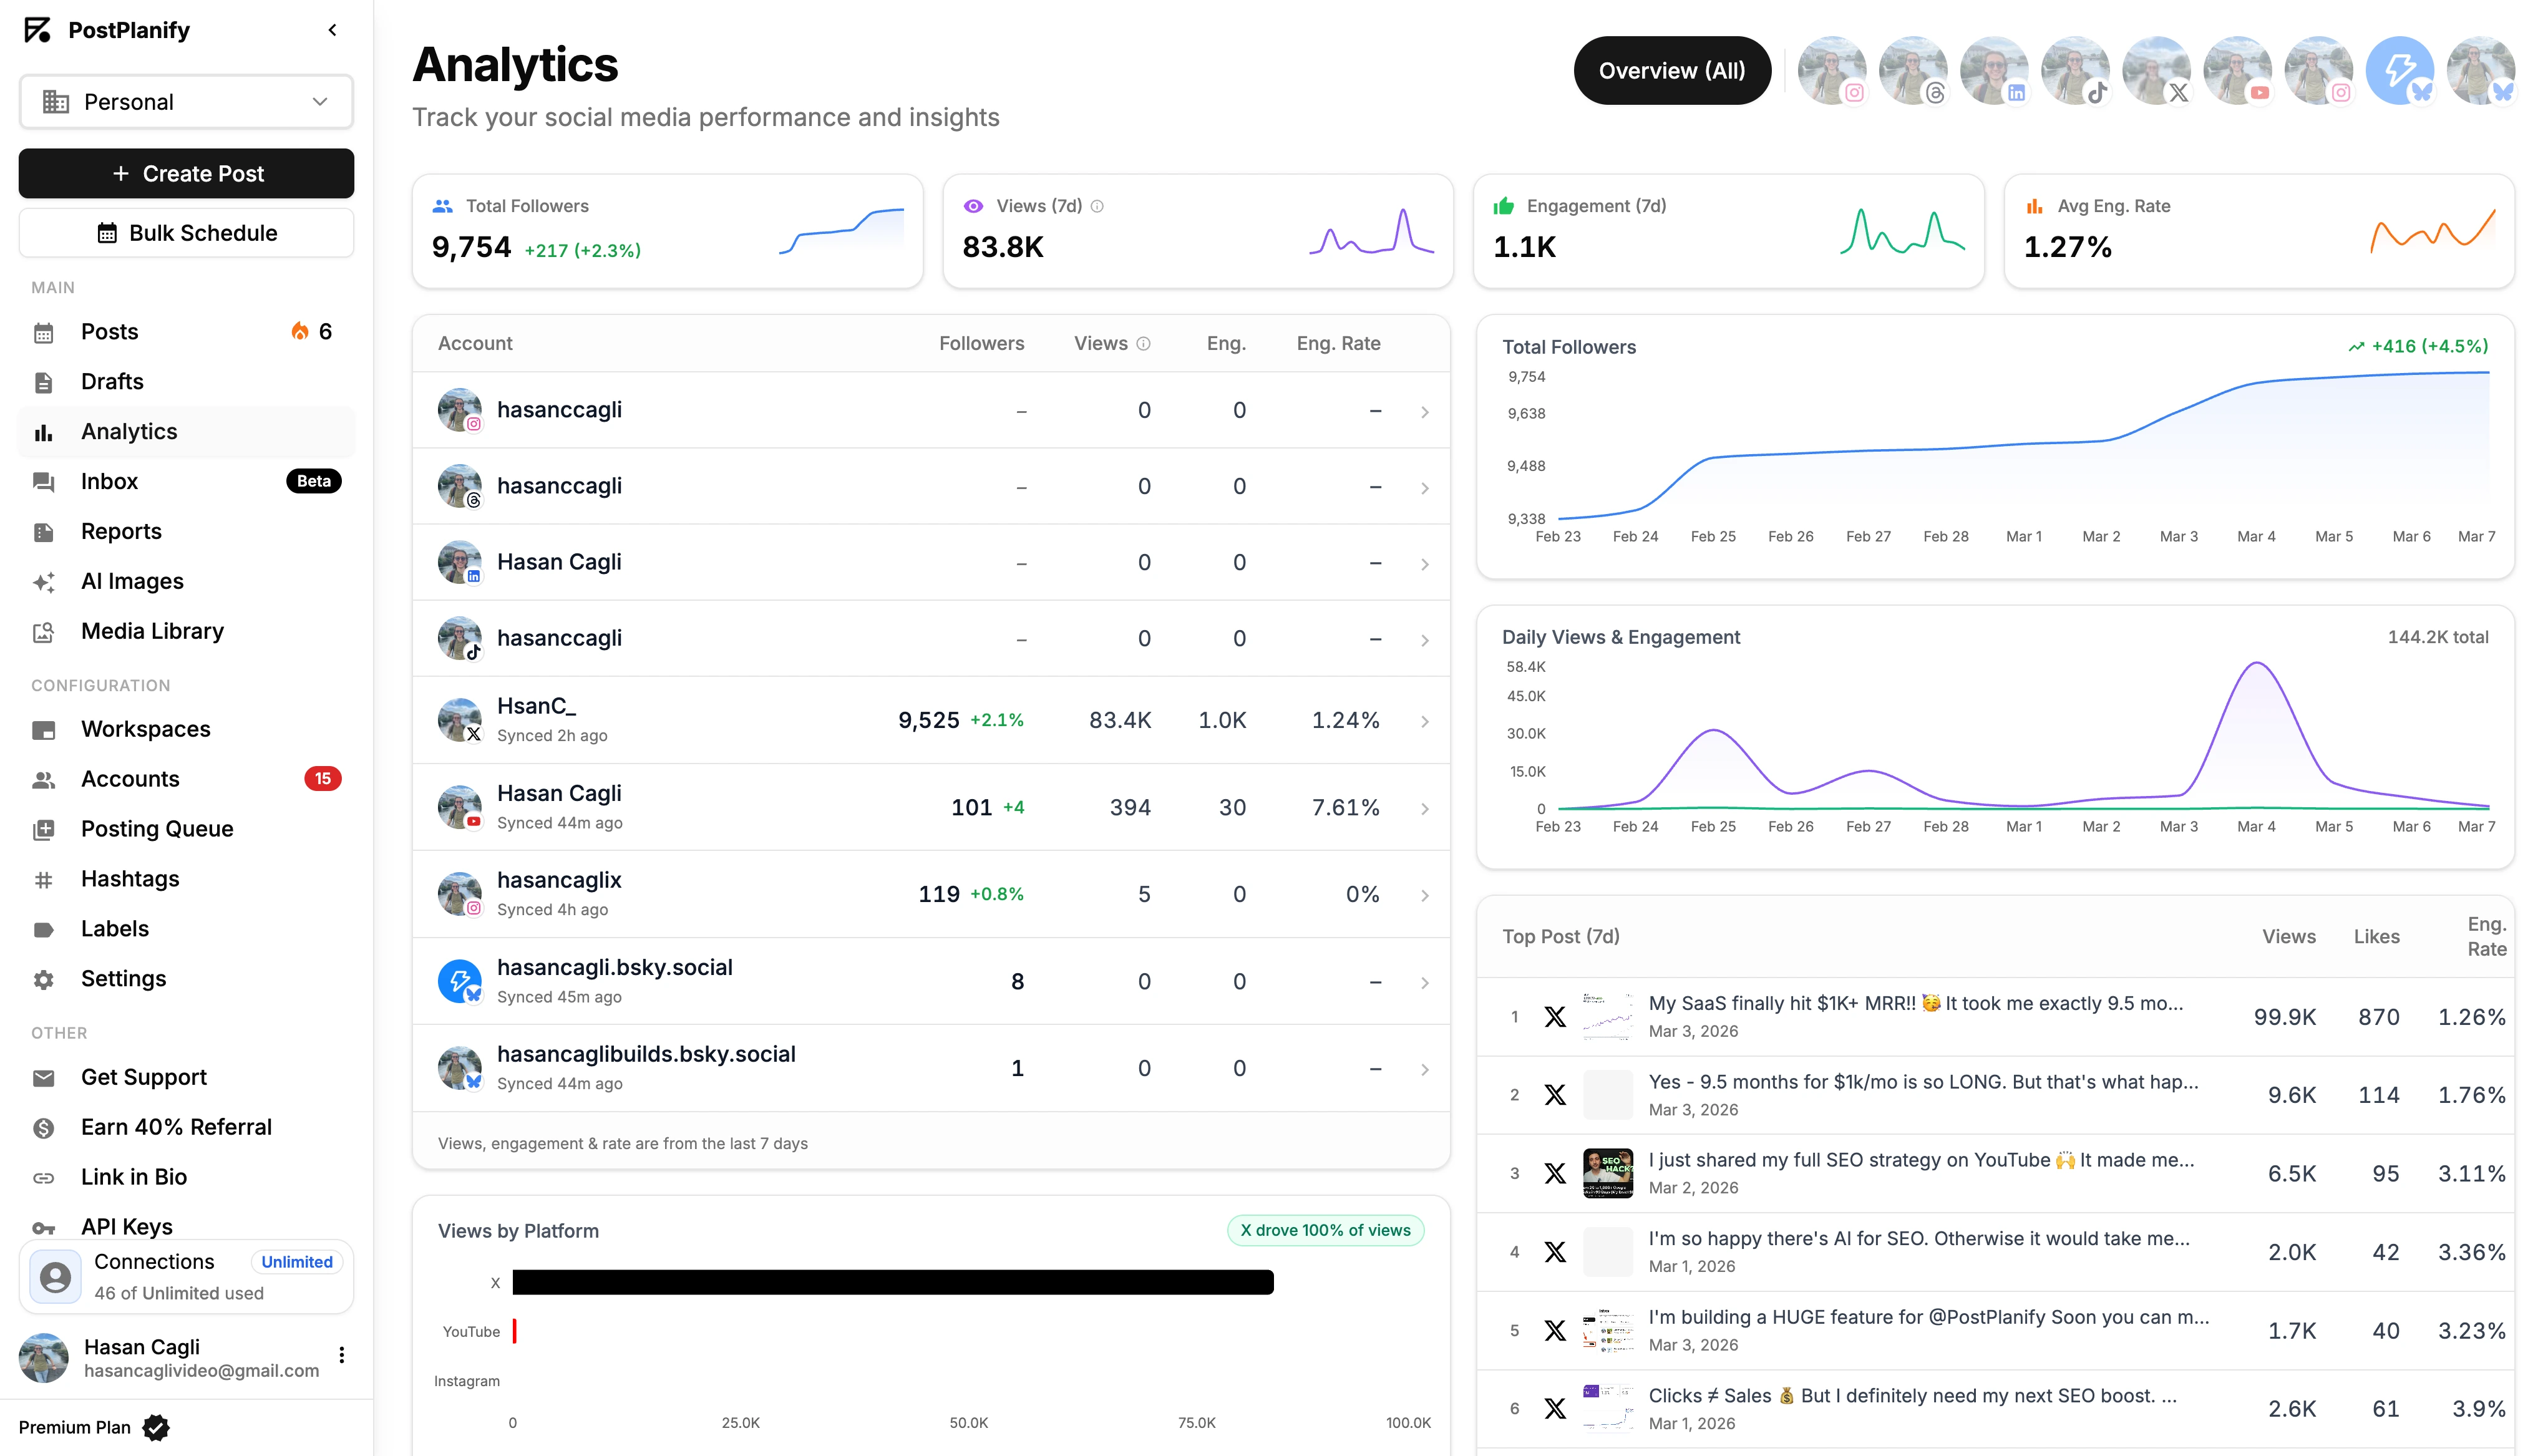
Why PostPlanify for Instagram Business Analytics
For a single account with one person behind it, native Instagram Insights covers the basics. Once you're managing multiple accounts, running monthly client reports, or trying to spot trends across more than 90 days of audience data, the gaps in native tools start costing real time. Our Instagram analytics tools comparison ranks the options for exactly that job.
PostPlanify is built for that operational layer. It connects directly to Meta's official Instagram Graph API and stores analytics history in a way native Insights doesn't, so multi-month and multi-account comparisons stop being a manual export job.
What you get:
- Cross-platform analytics for Instagram, X, Facebook, TikTok, YouTube, LinkedIn, Threads, Pinterest, Bluesky, and Google Business — one dashboard, one report
- Best time to post suggestions for every connected Instagram account, based on your own audience activity, not generic averages
- AI assistant (vision-powered) that reviews your media and writes captions, hashtags, and CTAs tuned to the platform
- Social inbox for Instagram, Facebook, LinkedIn, YouTube, and Google Business — comments and DMs in one queue
- Team collaboration with 3–12 members depending on plan, plus approval workflows for client work
- White-label PDF reports (Scale plan) for delivering branded monthly analytics to clients
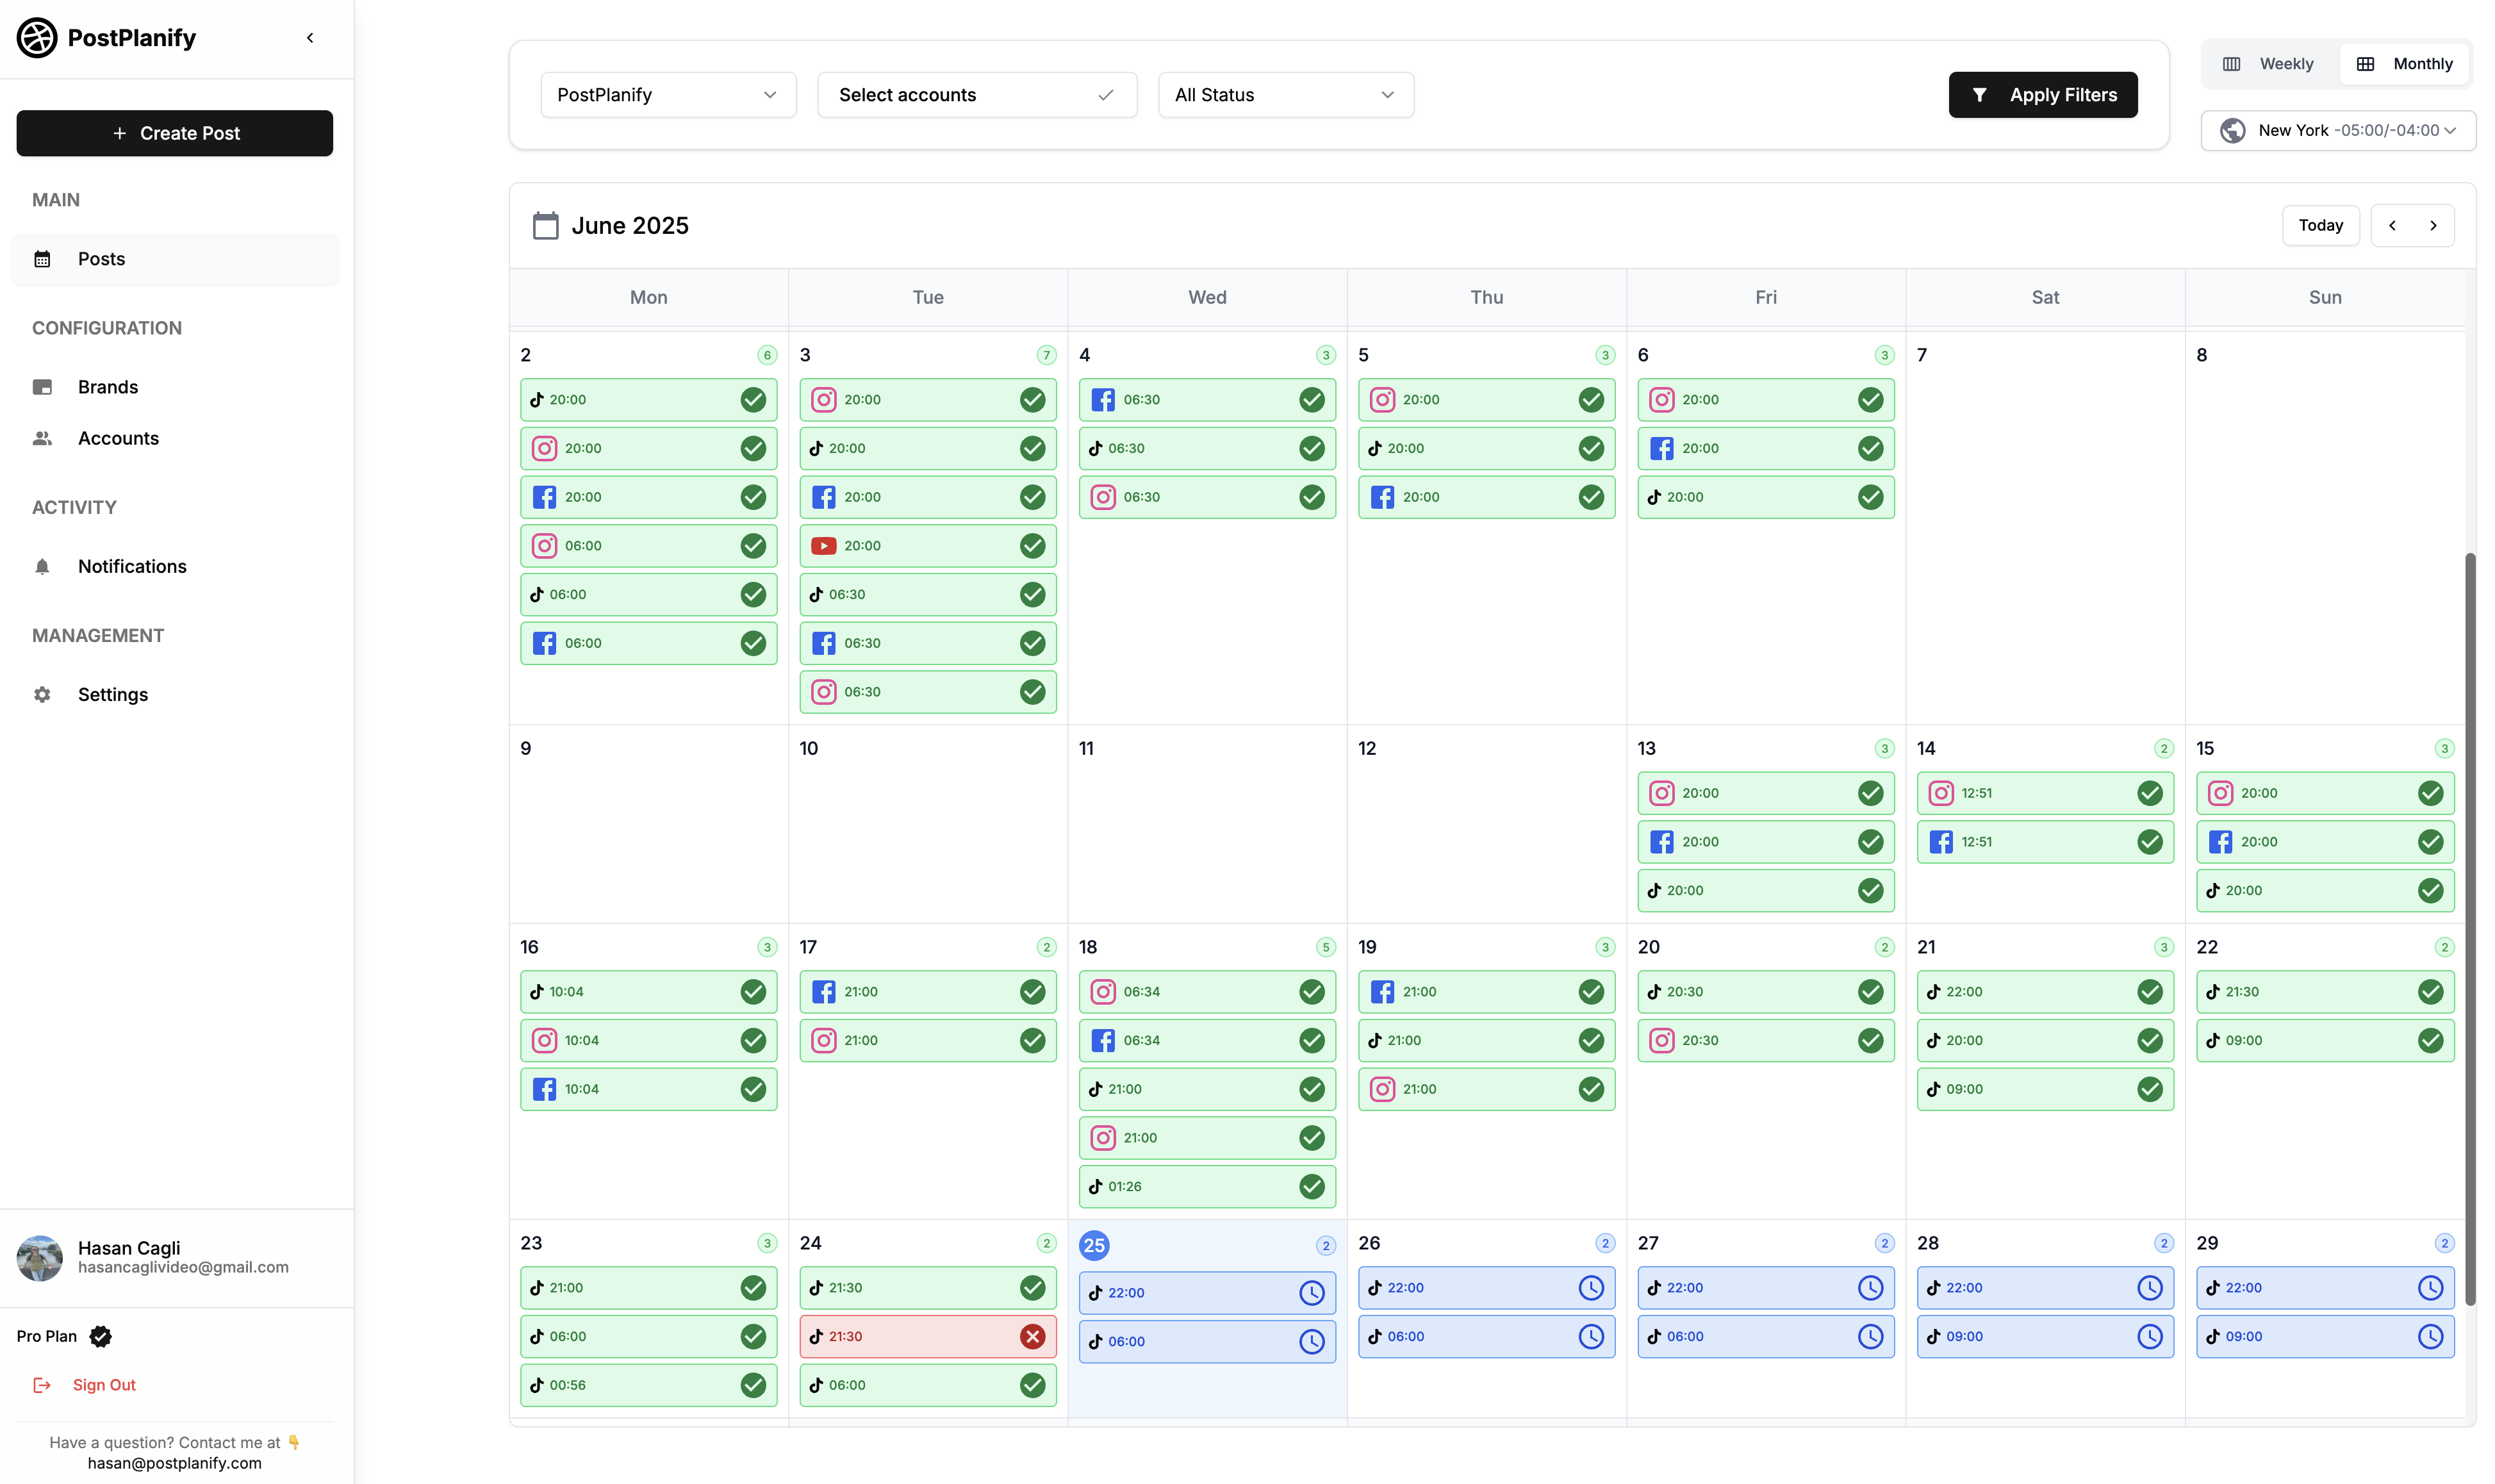
- Bulk scheduling and a content calendar so analytics tie back to a planned content strategy, not just past output
- Content tagging for campaigns, clients, or content pillars so you can filter analytics by initiative
Pricing starts at $79/mo billed yearly (or $99/mo monthly) on the Growth plan, which covers 15 social accounts and 3 team members. Premium adds approval workflows and 30 accounts; Scale adds white-label reports and bulk scheduling for 100 accounts and 50 workspaces.
Try PostPlanify free for 7 days — full analytics on every connected account.
Common Instagram Analytics Problems
A lot of Instagram reporting problems are measurement problems, not content problems. Teams react to a dip, change the plan too fast, and end up making the reporting less reliable than the performance itself.
Why is reach lower than impressions
They track different behavior. Reach is unique accounts. Impressions are total views.
If the same person sees a Reel twice, or returns to a post later, impressions increase while reach stays flat. That pattern is normal. The key question is whether repeated exposure is producing anything useful, such as saves, profile visits, replies, website taps, or DMs.
Why did my analytics suddenly drop
Start with the simple explanation before assuming the algorithm changed.
A drop often comes from one of four causes:
- Content mix shifted: You posted more of a format that usually underperforms for that account.
- Publishing cadence slipped: Inconsistent posting makes pattern analysis harder and often weakens distribution.
- Topic selection drifted: The content reflected internal priorities more than audience demand.
- Reporting periods changed: Different date ranges got compared as if they were equivalent.
Check the timeframe, format mix, posting frequency, and campaign context before changing strategy. That review usually explains more than a quick reaction ever will.
Why do third-party analytics tools sometimes differ from Instagram
The gap usually comes from API refresh timing, attribution windows, or differences in how a tool groups metrics. Instagram Insights should stay the reference point for platform-native numbers. External reporting tools are better for trend analysis across longer periods and across multiple accounts.
Consistency matters more than perfect alignment. Pick one reporting method for the quarter and stick with it.
What should I check every week
A weekly review should answer one question. What changed, and what will the team do next?
Use a short operating checklist:
- Top content by business-relevant actions such as saves, profile visits, replies, website taps, or DMs
- Weak patterns by format, topic, posting time, or CTA
- Audience shifts in engagement behavior or active times
- Conversion signals that suggest stronger intent, not just passive consumption
- One clear test for next week based on the strongest pattern you found
Keep it tight. A useful weekly review ends with one decision.
Instagram Business Account Analytics FAQ
How do I check Instagram analytics on a business account?
Open the Instagram app → tap your profile → tap Professional dashboard → tap Insights. From there you can see reach, engagement, content performance, and audience data. You must be on a Business or Creator account; personal accounts don't have Insights.
What's a good engagement rate for an Instagram business account?
The benchmark depends on your follower count. Accounts under 10,000 followers average about 0.98%, accounts between 10,000 and 100,000 average 0.68%, and accounts above 100,000 average 0.57%. The overall average across all sizes is around 0.45%. Compare against your trailing 3–6 months first, then against accounts your size in your niche.
How far back can I see Instagram Insights data?
Instagram retains 90 days of account-level data (Overview, Audience) and up to 2 years of content-level data (individual posts, Reels, Stories). For longer historical reporting, you need to either export regularly or use a third-party analytics tool that stores your data outside Instagram.
Why don't I see Insights on my Instagram account?
The most common cause is account type. Insights are only available on Business or Creator accounts. Switch via Settings → Account type and tools → Switch to professional account. If you still don't see Insights after switching, check that your account is linked to a Facebook Page (required for full data) and that you've published recent content — Insights take a few hours to populate after a new post.
Can I export Instagram analytics?
Native Instagram Insights only allows manual screenshots. Meta Business Suite allows limited exports. For full export capabilities — CSV, PDF, white-label — you need a third-party tool like PostPlanify, Sprout Social, or Hootsuite that stores your data and generates downloadable reports.
Does Instagram show who viewed my profile?
No. Instagram does not show individual users who viewed your profile, no matter the account type. You can see aggregate profile visits in Insights but never specific names. Apps that claim to show profile viewers are misleading and often violate Instagram's terms of service.
Can I see who saved my Instagram post?
No. Instagram only shows the total save count, not the individual users who saved a post. Use save patterns to identify which content formats and topics earn future-intent — saves correlate strongly with educational and reference content like carousels, how-to Reels, and checklists.
What's the best Instagram analytics tool?
For a single account, native Instagram Insights covers the basics. For multi-account reporting, historical comparisons, or client work, PostPlanify, Sprout Social, Hootsuite, and Iconosquare are the most commonly used. The right pick depends on whether you also need scheduling, social inbox, AI captioning, and approval workflows in the same tool — PostPlanify combines analytics with all of those for $79/mo (Growth plan, billed yearly).
How do I track Instagram ROI for my business?
Map Instagram metrics to revenue-adjacent actions: website taps, qualified DMs, product-tag interactions, and conversion-tagged campaigns. Use UTM parameters on bio links to attribute traffic and conversions back to Instagram inside Google Analytics. For service businesses, track DM-to-booked-call rates; for e-commerce, track product-tag click-through to checkout. See our full guide on ROI on social media for a framework.
Can I see Instagram analytics on desktop?
Yes — through Meta Business Suite at business.facebook.com on a desktop browser. The mobile Professional Dashboard remains the most up-to-date view, but Meta Business Suite is better for side-by-side reporting and longer-form analysis. For multi-account portfolio analytics on desktop, a dedicated analytics tool gives you a wider view than Meta-owned platforms alone.
Why did my Instagram analytics suddenly drop?
Before assuming an algorithm change, check four things: did your content mix shift toward formats that historically underperform on this account? Did your posting cadence slip? Did the topic selection drift away from what your audience engages with? Did you compare different date ranges as if they were equivalent? In most cases the answer is one of those four, not an algorithmic penalty.
How often should I check Instagram analytics?
A short weekly review (10–15 minutes) plus a structured monthly report works for most teams. Weekly: top content, weak patterns, one test for next week. Monthly: full trend view, KPI summary, content recommendations. Daily checking creates noise and reactive decision-making — you can't measure trends in 24-hour windows.
Are Instagram analytics free?
Yes. Native Instagram Insights and Meta Business Suite analytics are free for any Business or Creator account. You only pay when you need features native tools don't offer — historical data beyond 90 days, multi-account dashboards, white-label PDF exports, or cross-platform reporting.
Can I see analytics for my competitors on Instagram?
You can see public-facing data — follower count, post frequency, engagement on individual posts — but you cannot see private analytics like reach, profile visits, or audience demographics for accounts you don't own. For competitive benchmarking, third-party tools like Iconosquare and Sprout Social offer competitor tracking based on public data.
All your social media in one simple dashboard
Schedule posts, track analytics, and reply to comments/DMs — without switching tabs.
Engagement
+18%
Views
52.8k
Key Takeaways
- Instagram Insights are only available on Business or Creator accounts linked to a Facebook Page. Personal accounts can't access analytics — switch to professional first
- Native Insights retains 90 days of account-level data (reach, audience) and up to 2 years of post-level data. For longer history, use a third-party analytics tool that stores your data
- Match metrics to business goals. Reach for awareness, saves for content quality, profile visits for curiosity, website taps and DMs for conversion intent. Skip metrics that don't change a decision
- Engagement rate benchmarks scale inversely with follower count: 0.98% (under 10K), 0.68% (10K–100K), 0.57% (100K+). Compare against your own trailing 3–6 months first
- Build a monthly report with three sections: what changed, why it changed, what to do next. Skip screenshot dumps — they don't drive decisions
- Saves and DMs are the two most underrated KPIs for business intent. Saves correlate with future action better than likes; DMs correlate with conversion better than reach
- For multi-account reporting, native tools become a bottleneck — centralize across accounts with a dedicated analytics platform so historical and cross-brand comparisons stay consistent
- Weekly checks should end with one decision, not a list of observations. Monthly reports should end with a short action list tied directly to the findings
Quick Checklist
- ✅ Use a Business or Creator account linked to a Facebook Page
- ✅ Check Insights on a regular schedule (weekly + monthly)
- ✅ Separate metrics from KPIs — pick 2–3 KPIs per goal
- ✅ Report trends, not just totals
- ✅ Track actions that map to business goals, not vanity metrics
- ✅ Use a repeatable reporting template every month
- ✅ Centralize reporting when multiple accounts make native Insights too slow
- ✅ Store historical snapshots outside Instagram for quarterly reviews
If you manage one account, Instagram's native tools can cover the basics. If you manage a client portfolio, the bottleneck is usually not data access. It is reporting time, inconsistent definitions, and the work of turning scattered account-level metrics into decisions a team or client can use.
PostPlanify helps solve that operational layer. Teams can plan content, compare account performance, track analytics across profiles, and produce cleaner reports from one place instead of rebuilding the same reporting workflow every month.
Try PostPlanify free for 7 days — analytics for Instagram, TikTok, X, LinkedIn, YouTube, Facebook, Threads, Pinterest, Bluesky, and Google Business in one dashboard.
Related Reading
- How to See Scheduled Posts on Instagram
- How to Schedule Instagram Posts: Full Guide
- Best Time to Post on Instagram
- Instagram Image Size Guide
- Views vs Impressions: What's the Difference?
- Social Media Analytics for Business
- How to Create a Social Media Report
- ROI on Social Media
- Instagram Post Scheduler Tools 2026
- How to Schedule Instagram Reels
- Instagram Carousel Guide
- How to Collaborate on Instagram
- Instagram Scheduled Posts Not Working? 10 Quick Fixes
- Best Social Media Scheduling Tools
- How to Link Facebook and Instagram
All your social media in one simple dashboard
Schedule posts, track analytics, and reply to comments/DMs — without switching tabs.
Engagement
+18%
Views
52.8k
About the Author

Hasan Cagli
Founder of PostPlanify, a content and social media scheduling platform. He focuses on building systems that help businesses, agencies, and teams plan, publish, and manage content and social media more efficiently across platforms.


