
Struggling to justify your social media budget or prove your work is driving real business results? Measuring your roi on social media is the only way to connect your posts, videos, and campaigns to what leadership actually cares about: revenue, leads, and profit. This guide gives you the practical, step-by-step process to calculate it accurately.
The core formula is simple: [(Profit - Investment) / Investment] x 100. But getting the right numbers to plug into that formula is where most marketers get stuck. We'll break down exactly how to find those numbers, track them correctly, and use them to make smarter decisions.
Why You're Struggling to Prove Your Social Media ROI (And How to Fix It)
If you're pouring time and money into social media without a clear way to measure its return, you're essentially flying blind. You can't make smart budget decisions, you don't know which campaigns are actually working, and you can't confidently ask for more resources. It feels like you're just hoping the likes and shares will eventually turn into revenue.

Common Causes for Inaccurate ROI Measurement
- Problem: You're only tracking vanity metrics (likes, followers).
- Why it happens: These numbers are easy to find and look impressive on the surface, but they have no direct connection to business goals. A post can go viral and generate zero leads.
- The fix: Shift your focus to metrics that directly impact the bottom line, like conversions, cost per lead, and sales revenue.
- Problem: You can't prove which sales came from social media.
- Why it happens: Without proper tracking, you can't distinguish a customer who found you on Instagram from one who came from a Google search.
- The fix: Implement a consistent UTM tracking system for every link you post. This is non-negotiable for accurate attribution.
- Problem: You aren't accounting for all your costs.
- Why it happens: Many marketers only count their ad spend, forgetting about the cost of tools, content creation, and, most importantly, their team's time.
- The fix: Tally up every expense—software subscriptions, freelance fees, and the hourly cost of your team's labor—for a true picture of your investment.
The Benefit of a Standardized Process
Having a consistent process to measure your social media ROI turns vague activities into hard data. This allows you to:
- Justify Your Budget: Show executives exactly how much revenue social media generates for every dollar spent.
- Optimize Your Campaigns: Identify which platforms, content, and ads deliver the best return so you can double down on what works.
- Connect to Business Goals: Draw a clear line from your team’s efforts to high-level company objectives like lead generation and customer acquisition.
The goal is to transform your social media from a perceived cost center into a proven growth engine. When you can report on financial returns, the conversation shifts from "how many followers did we get?" to "how much pipeline did we build?"
Before you start crunching numbers, it helps to know where you stand today. A great first step is to run a full audit of your current accounts. If you need a hand, check out our guide on how to conduct a social media audit to build a strong foundation.
Step 1: Set Business Goals, Not Social Media Goals
Trying to measure social media ROI without clear, business-focused goals is like starting a road trip with no destination. You'll burn a lot of fuel, but you'll have no idea if you ever arrived. Before you can prove your efforts are paying off, you must define what "paying off" means for your business.
Vague targets like "increasing brand awareness" are impossible to calculate an ROI for. Every post, campaign, and ad dollar must be tied to a specific, measurable business outcome. This is the foundation that makes your ROI calculations meaningful. Before we even get into social media, it's essential to understand how to measure marketing effectiveness and boost ROI in a broader sense, so your social strategy is a direct contributor to growth, not just busy work.
Go Beyond Vanity Metrics
Here’s the hard truth: vanity metrics like likes, shares, and follower counts don't have a built-in dollar value. A post with 10,000 likes that generates zero sales has a lower ROI than a "boring" post with just 50 clicks that brings in three high-value leads. Your goals have to reflect this reality.
Focus on objectives that have a clear financial impact. Here are four common business-centric goals for social media:
- Generate High-Quality Leads: This is about filling your sales pipeline with prospects who are genuinely interested and likely to convert, not just collecting email addresses.
- Drive Direct Sales: For e-commerce, this is the most direct path to ROI. The goal is to turn followers into customers directly from their feed.
- Increase Converting Website Traffic: Driving clicks is only half the battle. The real goal is to bring people to your site who will then take a valuable action, like signing up for a demo or making a purchase.
- Improve Customer Loyalty and Retention: It's almost always cheaper to keep an existing customer than to find a new one. This goal focuses on using social media to build community and increase customer lifetime value (CLV).
Map Your Goals to Specific KPIs
Once you’ve locked in your main business goal, you need to identify the key performance indicators (KPIs) that will track your progress. Think of KPIs as the signposts on your road trip—they tell you if you're headed in the right direction. Tying your work to the right metrics is absolutely critical for an accurate ROI calculation.
Key Takeaway: Your KPIs are the bridge between your social media activity and your business results. If you can't measure it with a specific metric that ties back to revenue or cost savings, it's not a strong enough goal for ROI calculation.
To make this crystal clear, let's map out which KPIs to track for a couple of those core business goals.
Here's a quick guide connecting common business objectives with the specific, trackable metrics you'll need to measure success and calculate your ROI.
Mapping Social Media Goals to Key Performance Indicators (KPIs)
| Business Goal | Primary Social Media KPI | Supporting Metrics | Example Platform Metric |
|---|---|---|---|
| Lead Generation | Cost Per Lead (CPL) | Lead Quality Score, Conversion Rate (Lead to Customer), Form Fills | LinkedIn Lead Gen Form submissions and cost per result. |
| Direct Sales | Return on Ad Spend (ROAS) | Conversion Rate, Average Order Value (AOV), Revenue Per Visitor | Instagram Shopping sales attributed to a specific ad campaign. |
| Website Traffic | Cost Per Click (CPC) | Bounce Rate, Pages Per Session, Goal Completions (in Google Analytics) | Clicks to website from a Facebook ad or organic post. |
| Customer Loyalty | Customer Lifetime Value (CLV) | Churn Rate, Repeat Purchase Rate, Engagement Rate in customer groups | Engagement rate within a private Facebook Group for existing customers. |
This table shows how every goal has a distinct set of metrics. You can't just track "engagement" for everything and hope for the best. You have to be specific.
Now, let's look at how this plays out in the real world.
If Your Goal is Lead Generation (B2B SaaS on LinkedIn) Here, your focus is on efficiency and quality, not just volume. A thousand junk leads are less valuable than ten that are actually ready to talk to your sales team.
- Primary KPI: Cost Per Lead (CPL)
- Supporting Metrics: Lead Quality Score, Form Fills from social, Gated Content Downloads.
- Platform-Specific Example (LinkedIn): Tracking how many users download a whitepaper from a Sponsored Content ad and then measuring what percentage of those leads are qualified by your sales team.
If Your Goal is Direct Sales (E-commerce on Instagram/Facebook) This is all about the transaction. Your social channels are basically digital storefronts.
- Primary KPI: Return on Ad Spend (ROAS)
- Supporting Metrics: Conversion Rate, Average Order Value (AOV) from social, Revenue per Visitor.
- Platform-Specific Example (Instagram): Using Instagram Shops and product tags to track how many sales are initiated directly from a post or Story, then measuring the total revenue against your ad spend.
If boosting conversions is on your radar, you might find our guide on improving client engagement metrics a helpful next read.
Related: Social Media Analytics for Business | Social Media Engagement Rate Calculator Guide | Social Media Best Practices
Manage All Your Social Accounts Without the Chaos
Schedule posts, track performance, and collaborate with your team.
Step 2: A Practical Guide to Calculating Social Media ROI
You've set your goals. Now for the math. This is where we connect the dollars you spend to the dollars you earn.
Forget complicated spreadsheets for a moment. At its core, the formula for social media ROI is actually pretty simple.
[(Profit - Investment) / Investment] x 100 = ROI %
That’s it. This equation tells you exactly how much profit you made for every dollar you put in. A result of 300% means you earned $3 in profit for every $1 you invested.
The trick is figuring out what numbers to plug in. To really understand the value you're creating, you have to nail the fundamentals of measuring content marketing ROI. Let's break down each side of that formula so you can get a number you can actually trust.
Action 1: Tally Up Your Total Investment
First, you need to know what you’re spending. This is almost always more than just your ad budget. For a true ROI figure, you have to account for every single cost. Missing something here will give you a dangerously inflated result.
Your total investment should include:
- Ad Spend: The money you pay directly to platforms like Meta, TikTok, or LinkedIn to run your ads.
- Tool Subscriptions: Monthly or annual fees for scheduling software (like PostPlanify), analytics tools, design apps (like Canva), and anything else in your stack.
- Content Creation Costs: Did you hire a freelance photographer, video editor, or copywriter? Include those costs. If you create content in-house, you must account for the time it took.
- Team Time (Labor Costs): This is the cost everyone forgets. Calculate the hourly rate for your social media manager (and anyone else involved), then multiply it by the hours they spend on social media each month.
Action 2: Calculate Your Monetary Return (Profit)
Now for the other side of the equation: your return. This means putting a clear dollar value on the actions and sales that come from your social media activity. Your tracking has to be on point here.
To do this right, you’ll need a few key business metrics:
- Average Order Value (AOV): For e-commerce, this is the average amount a customer spends in a single transaction.
- Customer Lifetime Value (LTV): The total amount of money you expect to earn from a single customer over their entire relationship with you. This is a critical metric for subscription or high-value businesses.
- Average Lead Value: Crucial for B2B. Take your total sales revenue from leads and divide it by the number of leads you generated. For example, if 100 leads result in $10,000 in new business, each lead is worth $100.
This infographic perfectly shows how to connect your high-level goals to the final numbers you need for your ROI calculation.

Without this clear path from Goal to KPI to a final monetary Result, you're just guessing.
Action 3: Use UTM Parameters to Track Everything
How do you prove a sale came from that one Instagram post and not a Google search? The answer is UTM parameters. They’re small bits of code added to the end of a URL that tell your analytics tools (like Google Analytics) exactly where a visitor came from.
A UTM link looks like this:
yourwebsite.com/product?utm_source=instagram&utm_medium=social&utm_campaign=spring_sale
This tag lets you trace website traffic, leads, and sales directly back to a specific channel and campaign. If you aren’t using them, an accurate ROI calculation is impossible.
Real-World Scenario 1: An E-commerce Brand on Instagram
Let’s put this all together with a practical example. Imagine an e-commerce store that sells handmade jewelry.
Investment (Monthly):
- Instagram Ad Spend: $1,500
- Content Creation (Photographer): $500
- Social Media Tools: $100
- Team Time (10 hours/week @ $30/hr): $1,200
- Total Investment: $3,300
Return (Monthly):
- Using UTM tracking, they know that 50 sales came directly from their Instagram efforts.
- Their Average Order Value (AOV) is $120.
- Total Revenue from Instagram: 50 sales x $120 = $6,000
- Assuming a 50% profit margin, the total profit is $3,000.
ROI Calculation:
- [($3,000 Profit - $3,300 Investment) / $3,300 Investment] x 100 = -9% ROI
This isn't a failure—it's a critical insight. It tells the brand they are losing money and need to either reduce costs or improve their conversion rate or AOV. Without this calculation, they would continue losing money without knowing why.
Real-World Scenario 2: A B2B Company on LinkedIn
Now for a B2B SaaS company using LinkedIn to get demo requests.
Investment (Monthly):
- LinkedIn Ad Spend: $2,500
- Content Creation (Whitepaper): $1,000
- Social Media Tools: $200
- Team Time (15 hours/week @ $50/hr): $3,000
- Total Investment: $6,700
Return (Monthly):
- They generated 40 qualified leads (demo requests) from their LinkedIn campaigns.
- Historical data shows that 1 in every 10 of these leads becomes a customer.
- Their Customer Lifetime Value (LTV) is $5,000.
- Value of Leads Generated: (40 leads / 10) x $5,000 LTV = $20,000
ROI Calculation:
- [($20,000 Return - $6,700 Investment) / $6,700 Investment] x 100 = 198.5% ROI
This is a number you can confidently take to your boss. It clearly justifies the LinkedIn strategy and budget by showing a strong, positive ROI.
Once you have all this data, the final step is presenting it in a way that makes sense. For some tips on that, check out our guide on how to create a social media report that will actually get read.
Related: How to Create a Social Media Report | Social Media Analytics and Reporting | Social Media Strategy Examples
Manage All Your Social Accounts Without the Chaos
Schedule posts, track performance, and collaborate with your team.
Step 3: Use the Right Tools for Tracking Your Social ROI
Getting an accurate read on your social ROI isn’t about buying the most expensive software. It’s about having the right tools that work together to give you a complete picture. If you're still shortlisting, our breakdown of the best social media analytics tools compares 11 options by pricing, AI features, and reporting depth.
Without a solid toolset, you're stuck trying to piece together data from multiple sources. It’s time-consuming and often leads to incorrect conclusions. Here are the essentials you need to track performance without getting lost in spreadsheets.
The biggest roadblock for most marketers isn't a lack of data; it's that their tools don't integrate well, making it impossible to see the true business impact of their work.
Action 1: Master Platform-Native Analytics
Before you spend money on software, become an expert with the free tools already available. Every major social platform has its own built-in analytics dashboard, providing a wealth of data on audience behavior and content performance.
- Meta Business Suite (Facebook & Instagram): Go beyond surface-level metrics. In the "Insights" tab, you'll find post reach, engagement rates, and detailed audience demographics. For paid ads, Ads Manager is where crucial ROI metrics live, like Cost Per Result, Conversion Value, and Return on Ad Spend (ROAS).
- LinkedIn Campaign Manager: For B2B, this is non-negotiable. It provides critical data on lead generation, including your Cost Per Lead (CPL) from Lead Gen Forms and conversion tracking for demo requests or downloads.
- TikTok Ads Manager & X Analytics: These platforms offer similar dashboards. The key is to focus on metrics that align with your business goals—don't get distracted by view counts if you need website traffic.
Action 2: Connect Social to Your Website with GA4
Platform analytics show you what happens on social media, but Google Analytics 4 (GA4) tells you what happens after someone clicks your link. This is how you connect your social media efforts to actual business results.
The most important step here is using UTM parameters. As mentioned earlier, these tags tell GA4 exactly where your traffic came from. Inside GA4, you can then build reports showing not just how many people came from Instagram, but how many of those people actually bought something or filled out a form.
Pro Tip: Set up "Events" in GA4 for every important action a user can take on your site (like 'generate_lead', 'purchase', or 'add_to_cart'). This lets you assign a dollar value to each conversion, making your ROI calculation way more accurate.
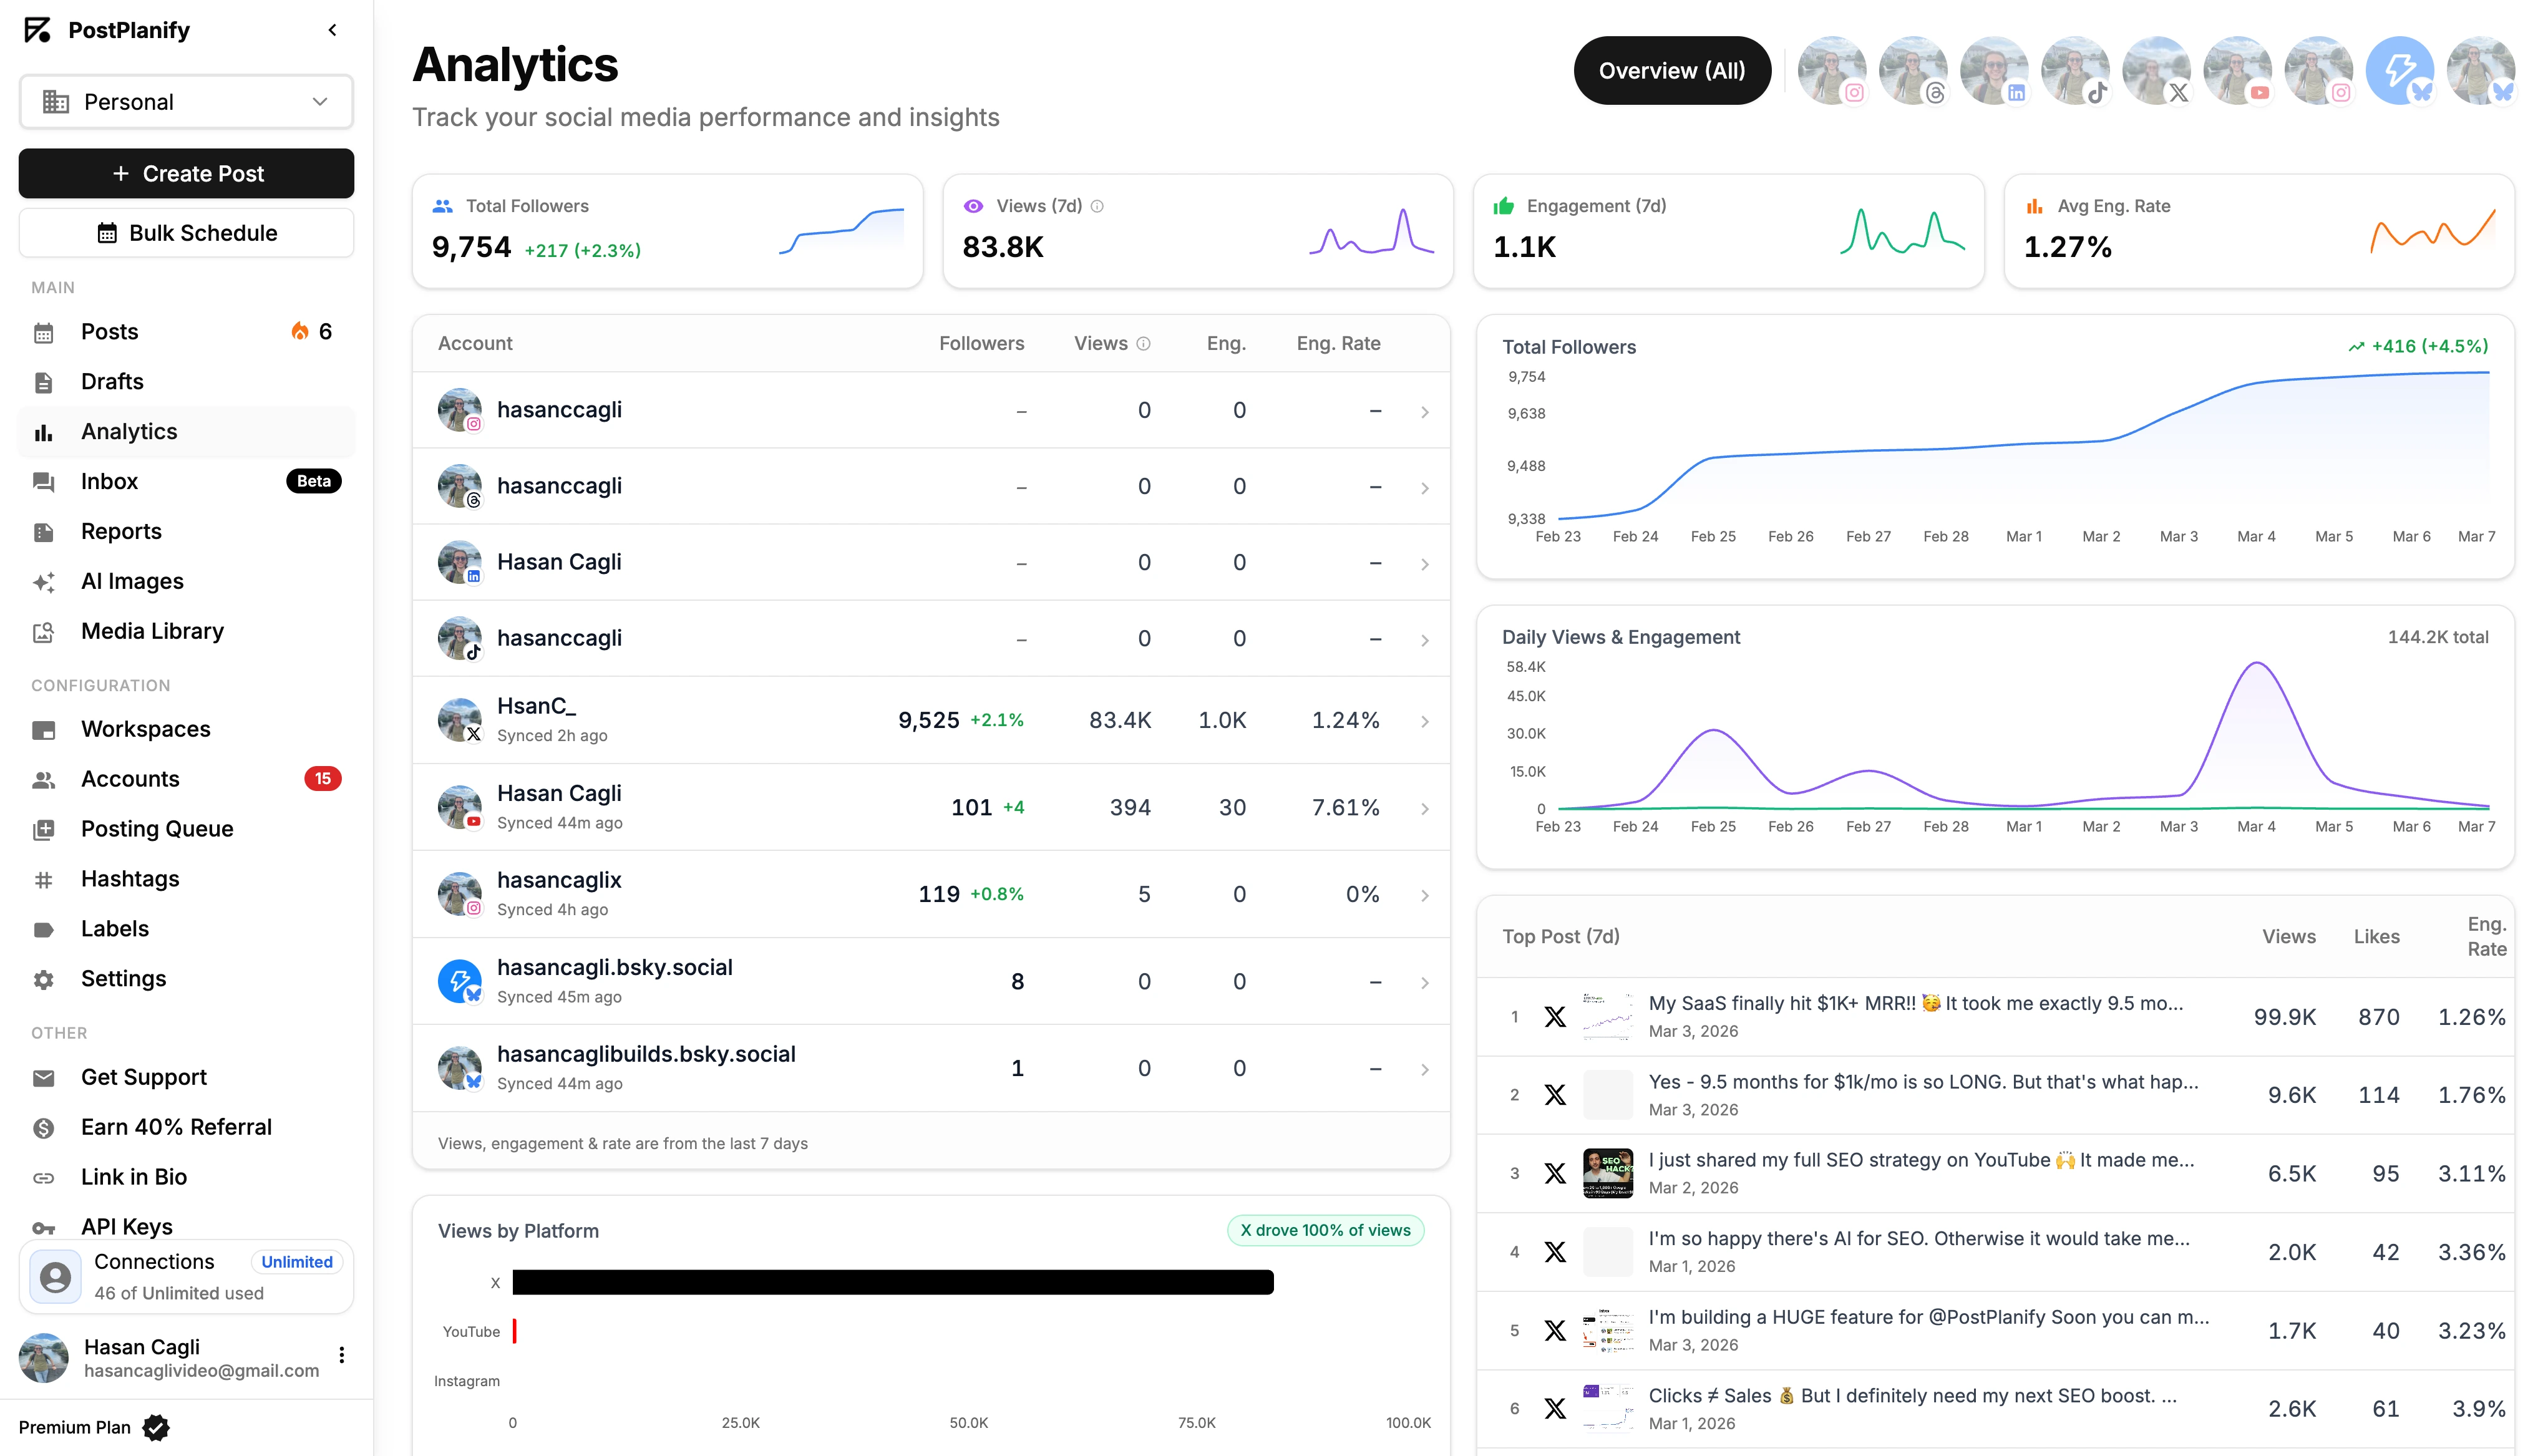
Action 3: Centralize Your Data with a Management Platform
Jumping between five different analytics dashboards every week is inefficient and leads to missed insights. This is where a social media management platform like PostPlanify becomes essential.
Instead of logging in and out of every platform, a tool like this pulls all your performance data into one clean dashboard. This centralized view saves hours of manual work and, more importantly, helps you spot cross-channel trends you would otherwise miss. It gives you a clear, big-picture view of your entire social media impact in one place. You can learn more about this in our deep dive into social media analytics and reporting.
Step 4: Take Action to Improve Your Social Media ROI
Knowing your ROI is just the first step. The goal is to make that number grow. Improving your roi on social media isn't about spending more money; it's about making smarter, data-driven decisions. These are practical strategies that work right now.

Fix 1: Master A/B Testing for Ads and Content
Stop guessing what will work. The fastest way to boost performance is to constantly test different elements of your campaigns. Even a small improvement in your click-through or conversion rate can have a massive impact on your final ROI.
A/B testing replaces assumptions with data, helping you identify the exact images, headlines, and calls-to-action that resonate with your audience.
Here’s a simple process:
- Isolate One Variable: This is critical. Only change one thing at a time—the headline, the image, the CTA button, or the ad copy. If you change multiple elements, you won't know which one caused the change in performance.
- Test Ad Creatives: Run two identical ads with different images or videos. See which one delivers a lower cost-per-click or a higher conversion rate.
- Test Audience Segments: Use the same ad but show it to two different audiences. For example, test a lookalike audience against an interest-based one to see which group converts more efficiently.
- Analyze and Iterate: Once you have a clear winner, turn off the losing ad. Then, create a new test based on what you learned. This cycle should be continuous.
Fix 2: Refine Audience Targeting with Data
Blasting your message to a broad audience is the quickest way to waste your budget. The more data you collect, the clearer the picture of your most profitable customer becomes. Precision is key to a higher ROI.
When you nail your targeting, you're not wasting ad spend on people who will never be interested. You're putting your message in front of those most likely to convert, which lowers your costs and increases your returns.
Here are a few ways to tighten your targeting:
- Create Lookalike Audiences: Platforms like Facebook and LinkedIn let you upload a list of your best customers. Their algorithms will then find new users with similar traits.
- Run Retargeting Campaigns: Show specific ads to people who have already visited your website, watched a video, or engaged with a post. These warm leads are almost always cheaper to convert.
- Exclude Underperforming Demographics: Dive into your ad reports. If you see that a certain age group, location, or gender consistently fails to convert, exclude them from future campaigns.
Fix 3: Optimize Your Posting Schedule
Posting when your audience is offline is like shouting into an empty room. To maximize your organic reach, you must publish when your followers are actively scrolling.
By posting at peak times, you give your content the best chance for initial visibility. This early traction signals to the platform's algorithm that your content is valuable, which can lead to it being shown to a wider audience—all without extra ad spend.
Key Insight: Optimizing your schedule is one of the easiest, no-cost ways to improve your social media ROI. You’re making your existing efforts work harder without spending more money.
This is where a social media management tool is invaluable. For example, PostPlanify’s ‘Best Time to Post’ feature analyzes your unique audience data to give you specific time slots, taking the guesswork out of scheduling.
For a deeper dive into boosting your organic results, check out our guide on how to improve social media engagement.
Fix 4: Invest in High-Performing Content Formats
Your own data is your best guide. It will tell you exactly what your audience wants to see. If short-form videos on TikTok are driving a great ROI, make more of them. If Instagram carousel posts are generating the most leads, create more carousels.
Focusing on proven formats is about efficiency. It ensures your time and creative energy are spent on what actually moves the needle, not on content that falls flat.
Here’s how to put this into action:
- Analyze Your Metrics Constantly: Make it a habit to review your analytics. Identify which content types—video, carousels, single images, text posts—are bringing in the most engagement, clicks, and conversions.
- Embrace User-Generated Content (UGC): Encourage customers to share photos and videos of your products. UGC acts as powerful social proof and is often a low-cost, high-impact source of content that resonates with potential buyers.
Related: How to Create Engaging Social Media Content | Best Time to Post on Social Media | Content Repurposing Strategies
Manage All Your Social Accounts Without the Chaos
Schedule posts, track performance, and collaborate with your team.
Understanding ROI Benchmarks for Major Platforms
Not every social platform is created equal. A "good" ROI on a B2B network like LinkedIn looks completely different from what you'd see on an awareness-driving platform like TikTok. If you're a creator evaluating which platforms deliver the best financial return, our breakdown of which social media platform pays the most compares earnings across every major channel.
Trying to get the same results from every channel is a fast way to waste your ad spend. You wouldn't use a 15-second dance video to sell complex enterprise software, and you wouldn't use a technical whitepaper to sell a t-shirt. Matching the platform to your business goal is the first step to a positive ROI.
E-commerce Powerhouses: Facebook and Instagram
For e-commerce and direct-to-consumer brands, Meta’s platforms are top performers. Their ad targeting is sophisticated, the formats are visual-first, and built-in shopping features create a smooth path from discovery to checkout.
- Facebook: Excellent for zeroing in on specific demographics. It's a workhorse for driving direct sales, especially for products with broad appeal.
- Instagram: The hub for product discovery. Features like Reels, Stories, and influencer marketing are perfect for visually-driven brands in fashion, beauty, and home goods.
For many D2C brands, Facebook leads with an average ROI of over 150%, with Instagram close behind.
High-Value Leads on LinkedIn
For B2B companies, LinkedIn is in its own league. While the cost-per-click is higher, the quality of leads it generates is often unmatched. Professionals on LinkedIn have a business mindset, making them more receptive to industry content and B2B offers.
The ROI math for LinkedIn is less about immediate sales and more about lead value and customer lifetime value (LTV). A single high-value lead that becomes a long-term client can justify an entire campaign's budget.
This is why B2B marketers consistently see returns of 200% or more from LinkedIn, despite the premium ad costs.
Top-of-Funnel Awareness on X and TikTok
Not every campaign is about an immediate sale. Some channels excel at building brand awareness and reaching new audiences. Understanding how impressions work across platforms helps you set the right KPIs for awareness-focused campaigns.
- TikTok: Its algorithm is engineered for discovery, making it a powerhouse for top-of-funnel marketing. While direct sales attribution can be tricky, its impact on brand recognition, especially with younger demographics, is undeniable.
- X: Built for real-time engagement and customer service. Its ROI is often measured in metrics like brand sentiment, community growth, and driving traffic to blog posts or news articles.
Troubleshooting & FAQs
Even with a clear process, a few common questions always come up. Here are direct answers to help you solve them.
How often should I measure social media ROI?
You should operate on two schedules:
- Weekly (For Active Ads): Check the performance of any paid campaigns weekly. This allows you to quickly shift budget away from underperforming ads and toward winners before you waste money.
- Monthly/Quarterly (For Strategy): Conduct a full, comprehensive ROI analysis monthly or quarterly. This provides enough data to see meaningful trends and make smart strategic decisions for the future.
What is a "good" ROI for social media marketing?
While there's no single magic number, a common benchmark to aim for is a 5:1 ratio, which is a 400% ROI. This means for every $1 you invest, you get $5 back in revenue.
However, context is critical. A brand awareness campaign will have a lower direct financial ROI than a bottom-of-funnel retargeting ad. The best approach is to benchmark against yourself. Focus on improving your own ROI month over month.
How do I measure the ROI of organic social media?
Measuring the ROI of your organic (non-paid) posts is trickier but definitely possible.
- Track the Return: Use unique UTM parameters in every single link you share in your organic posts. This lets you go into Google Analytics and see exactly how much traffic, leads, and sales came from a specific post.
- Calculate the Investment: This is primarily the cost of your team's time. Calculate the hours spent creating, scheduling, and engaging with your organic content, and multiply that by their hourly cost. Add in any relevant tool or content creation costs.
- Use the Formula: Once you have the return (from your UTM data) and the investment (your team's time and costs), plug them into the standard ROI formula.
What tools do I need to measure social media ROI?
At minimum, you need three things working together: platform-native analytics (Meta Business Suite, LinkedIn Campaign Manager, TikTok Analytics) to track on-platform performance, Google Analytics 4 with UTM parameters to attribute website conversions back to social, and a centralized dashboard like PostPlanify to pull all your data into one place. The native tools are free, and GA4 is free. A management platform saves hours of manual data wrangling and helps you spot cross-channel trends that are impossible to see when you're jumping between dashboards.
Is social media marketing worth the investment?
Yes — when it's measured and optimized properly. The challenge is that many businesses feel like social media isn't working because they aren't tracking the right metrics. When you focus on vanity metrics (likes, followers), it's hard to see the business value. But when you track conversions, cost per lead, and revenue attribution, social media consistently proves to be one of the most cost-effective marketing channels available. The key is having a measurement system in place so you can identify what's working and cut what isn't.
What is the average ROI on social media ads?
Averages vary widely by platform and industry. For e-commerce brands, Facebook and Instagram ads often deliver a 3:1 to 5:1 ROAS (return on ad spend), meaning $3-$5 in revenue for every $1 spent. B2B companies on LinkedIn typically see higher cost-per-click but stronger lead quality, with ROI often exceeding 200% when measured by customer lifetime value. TikTok ads are newer but showing strong results for awareness-to-conversion campaigns targeting younger demographics. The most important benchmark is your own — track your ROI monthly and focus on improving it over time.
How do I prove social media ROI to my boss or clients?
Build a report that connects social media activity directly to business outcomes. Start with the goals you agreed on, show performance against those specific KPIs, and include the actual ROI calculation with real dollar figures. Use visuals — charts showing revenue attributed to social, cost-per-lead comparisons across channels, and month-over-month trend lines. Avoid leading with vanity metrics. For a detailed walkthrough, see our guide on how to create a social media report that stakeholders will actually read.
Should I measure ROI differently for each social media platform?
Yes. Each platform serves different business objectives, so the KPIs and ROI calculations should reflect that. For Instagram and Facebook, focus on ROAS, conversion rate, and average order value if you're in e-commerce. For LinkedIn, prioritize cost per lead and lead-to-customer conversion rate. For TikTok and X, you may need to factor in brand awareness metrics like reach and video completion rate alongside any direct conversion data. The ROI formula stays the same — what changes is how you define and measure the "return" for each platform.
Ready to stop guessing and start measuring with a tool that consolidates all your data? PostPlanify brings your analytics from every platform into one dashboard, helping you track performance, find your best time to post, and prove your ROI with ease. Start your free 7-day trial today.
Also read: How to Measure Social Media ROI | How to Create a Social Media Report | Social Media Analytics and Reporting | Social Media Best Practices | Best Social Media Management Platform | Save Time on Social Media Management | What Social Media Platform Pays the Most
Manage All Your Social Accounts Without the Chaos
Schedule posts, track performance, and collaborate with your team.
About the Author

Hasan Cagli
Founder of PostPlanify, a content and social media scheduling platform. He focuses on building systems that help businesses, agencies, and teams plan, publish, and manage content and social media more efficiently across platforms.


