
Confused about why your Instagram Reels have 10,000 views but your analytics dashboard shows only 8,000 impressions? You’re not alone. The terms views and impressions are often used interchangeably, but they measure two completely different things. Mixing them up leads to flawed reports and bad strategic decisions.
Here’s the direct answer: an impression is counted the moment your content is displayed on a screen. A user could scroll right past it, and it still counts. A view, on the other hand, is almost always tied to a specific action—usually watching a video for a minimum amount of time (like 3 seconds on Facebook).
Understanding this difference is critical for diagnosing your content's performance. It helps you answer the most important question: are people just seeing your content, or are they actually paying attention to it?
Views vs Impressions vs Reach: A Quick Reference Guide
To make your reports truly useful, you need to understand three core metrics: views, impressions, and reach. Each one tells a different part of your content's story. If you're only tracking one, you're missing the full picture.
Here's a simple breakdown to solve the confusion:
| Metric | What It Measures | Real-World Scenario | Actionable Insight |
|---|---|---|---|
| Impressions | The total number of times your content is displayed on a screen. This includes multiple appearances to the same user. | One user sees your LinkedIn post in their feed in the morning and again in the afternoon. This counts as 2 impressions. | Tells you how well you're playing the algorithm's game and getting your content distributed. |
| Views | The number of times your content (usually video) is watched for a platform-specific minimum duration. | A user watches the first 3 seconds of your Facebook video before scrolling away. This counts as 1 view. | Tells you if your content's hook was strong enough to capture initial attention. |
| Reach | The number of unique people who saw your content at least once. | The same user who saw your post twice is only counted once. Your reach is 1. | Tells you the actual size of the audience you connected with. |
Practical Takeaway: If a single user sees your post twice, you get 2 impressions but only 1 reach. If they watch your video both times, you might get 2 views. High impressions with low reach means you're repeatedly showing content to the same small audience.
This isn't just theory; it's a strategic necessity. For example, Instagram is increasingly prioritizing 'Views' across formats like Reels, signaling a shift toward valuing active consumption over passive exposure. In contrast, TikTok practically treats a 'view' as an impression, while platforms like X and YouTube have stricter rules. Knowing these platform-specific definitions is the only way to make accurate cross-platform comparisons in a tool like PostPlanify. For a deeper look, check out our guide on understanding social media impressions.
How Each Social Platform Actually Measures Views
A "view" on TikTok is not the same as a "view" on YouTube. This is the source of massive reporting headaches for social media managers. If you don't know the specific rules each network plays by, you can't accurately compare the performance of a video across different platforms.
One platform’s ‘view’ is another’s fleeting glance. To fix your reports and truly understand your analytics, you have to know these platform-specific definitions. Otherwise, you’re not comparing apples to apples—you're comparing milliseconds to 30-second intentional watches.
This diagram breaks down the core difference: an impression is about potential visibility, while a view is about active consumption.

The key difference is that a view almost always requires a user to watch for a specific amount of time, signaling a higher level of intent than a passive impression.
Instagram and Facebook Views
Meta’s platforms—Instagram and Facebook—share a similar rule for most video formats. For in-feed videos and Reels, they count a view after 3 seconds of continuous watch time.
Common Problem: Your view counts look great, but engagement is low.
- Why it Happens: The 3-second rule includes silent autoplay views. A user scrolling their feed can trigger a "view" without ever paying attention. This means your first 3 seconds are make-or-break. If your hook is weak, you'll get a view but nothing else.
- Platform-Specific Detail: For Stories, the rule is different. A view is counted almost instantly when a user taps into your Story. This is why you need to separate Story analytics from Reels analytics. Learn more in our breakdown of views on Instagram Stories. Curious how views translate to revenue? See how much Facebook Reels pay per 1,000 views.
TikTok Views
TikTok has the most generous definition of a view. A view is counted the instant a video starts playing in someone’s feed. There is no minimum watch time—not even one second.
Common Problem: Your TikTok video has a million views but very few comments or saves.
- Why it Happens: On TikTok, a "view" is functionally the same as an "impression." The platform is built for rapid discovery, so every time your video appears and autoplays, even for a split-second as someone scrolls, it adds to your view count.
- Actionable Fix: Ignore the raw view count as a measure of quality. Instead, focus on average watch time and completion rate. These metrics tell you if your content actually resonated or if it was just another video in the endless scroll. For context on what those views are worth, check out how much TikTok pays for 1 million views.
YouTube and YouTube Shorts Views
For standard long-form videos, YouTube has the strictest definition. A view is only counted after a user intentionally watches for about 30 seconds.
Common Problem: Your YouTube video's view count is much lower than your social media video views.
- Why it Happens: The 30-second rule filters out accidental clicks and passive scrollers, giving you a metric that signals genuine viewer intent. A YouTube view is a much stronger indicator of interest.
- Edge Case (YouTube Shorts): For Shorts, the rules are more like TikTok's. A view is counted when a Short is played in the feed. This means you must analyze your long-form video data separately from your Shorts data to get an accurate picture of performance. For more on YouTube monetization, see how much YouTube pays for 1,000 views.
LinkedIn Views
LinkedIn uses a time- and visibility-based rule for video. A view is counted after 2 continuous seconds of playback while at least 50% of the video player is visible on the screen.
Common Problem: Your LinkedIn video analytics show fewer views than you expected, even with autoplay.
- Why it Happens: The "50% on-screen" requirement is stricter than Meta's rule. It ensures the video was actually visible to the user, not just auto-playing off-screen.
- Platform-Specific Detail: For non-video content like articles or carousels, a "view" is typically counted when a user clicks "see more" to expand the content. This active click makes it a stronger indicator of interest than a simple impression.
X (Twitter) Views
X (formerly Twitter) has a viewability standard nearly identical to LinkedIn's. A view is counted when a user watches a video for at least 2 seconds with at least 50% of the video in-view.
- Why it Matters: This standard helps provide a more honest measure of who is actually stopping to watch your content in the fast-moving feed. It filters out users who just scroll past without the video being meaningfully visible.
- **For a deeper dive into how this all fits together, it's worth understanding the full attribution picture in an impression vs click breakdown.
Related: Social Media Impressions | Views on Instagram Stories | Instagram Reels Algorithm | Social Media Analytics and Reporting
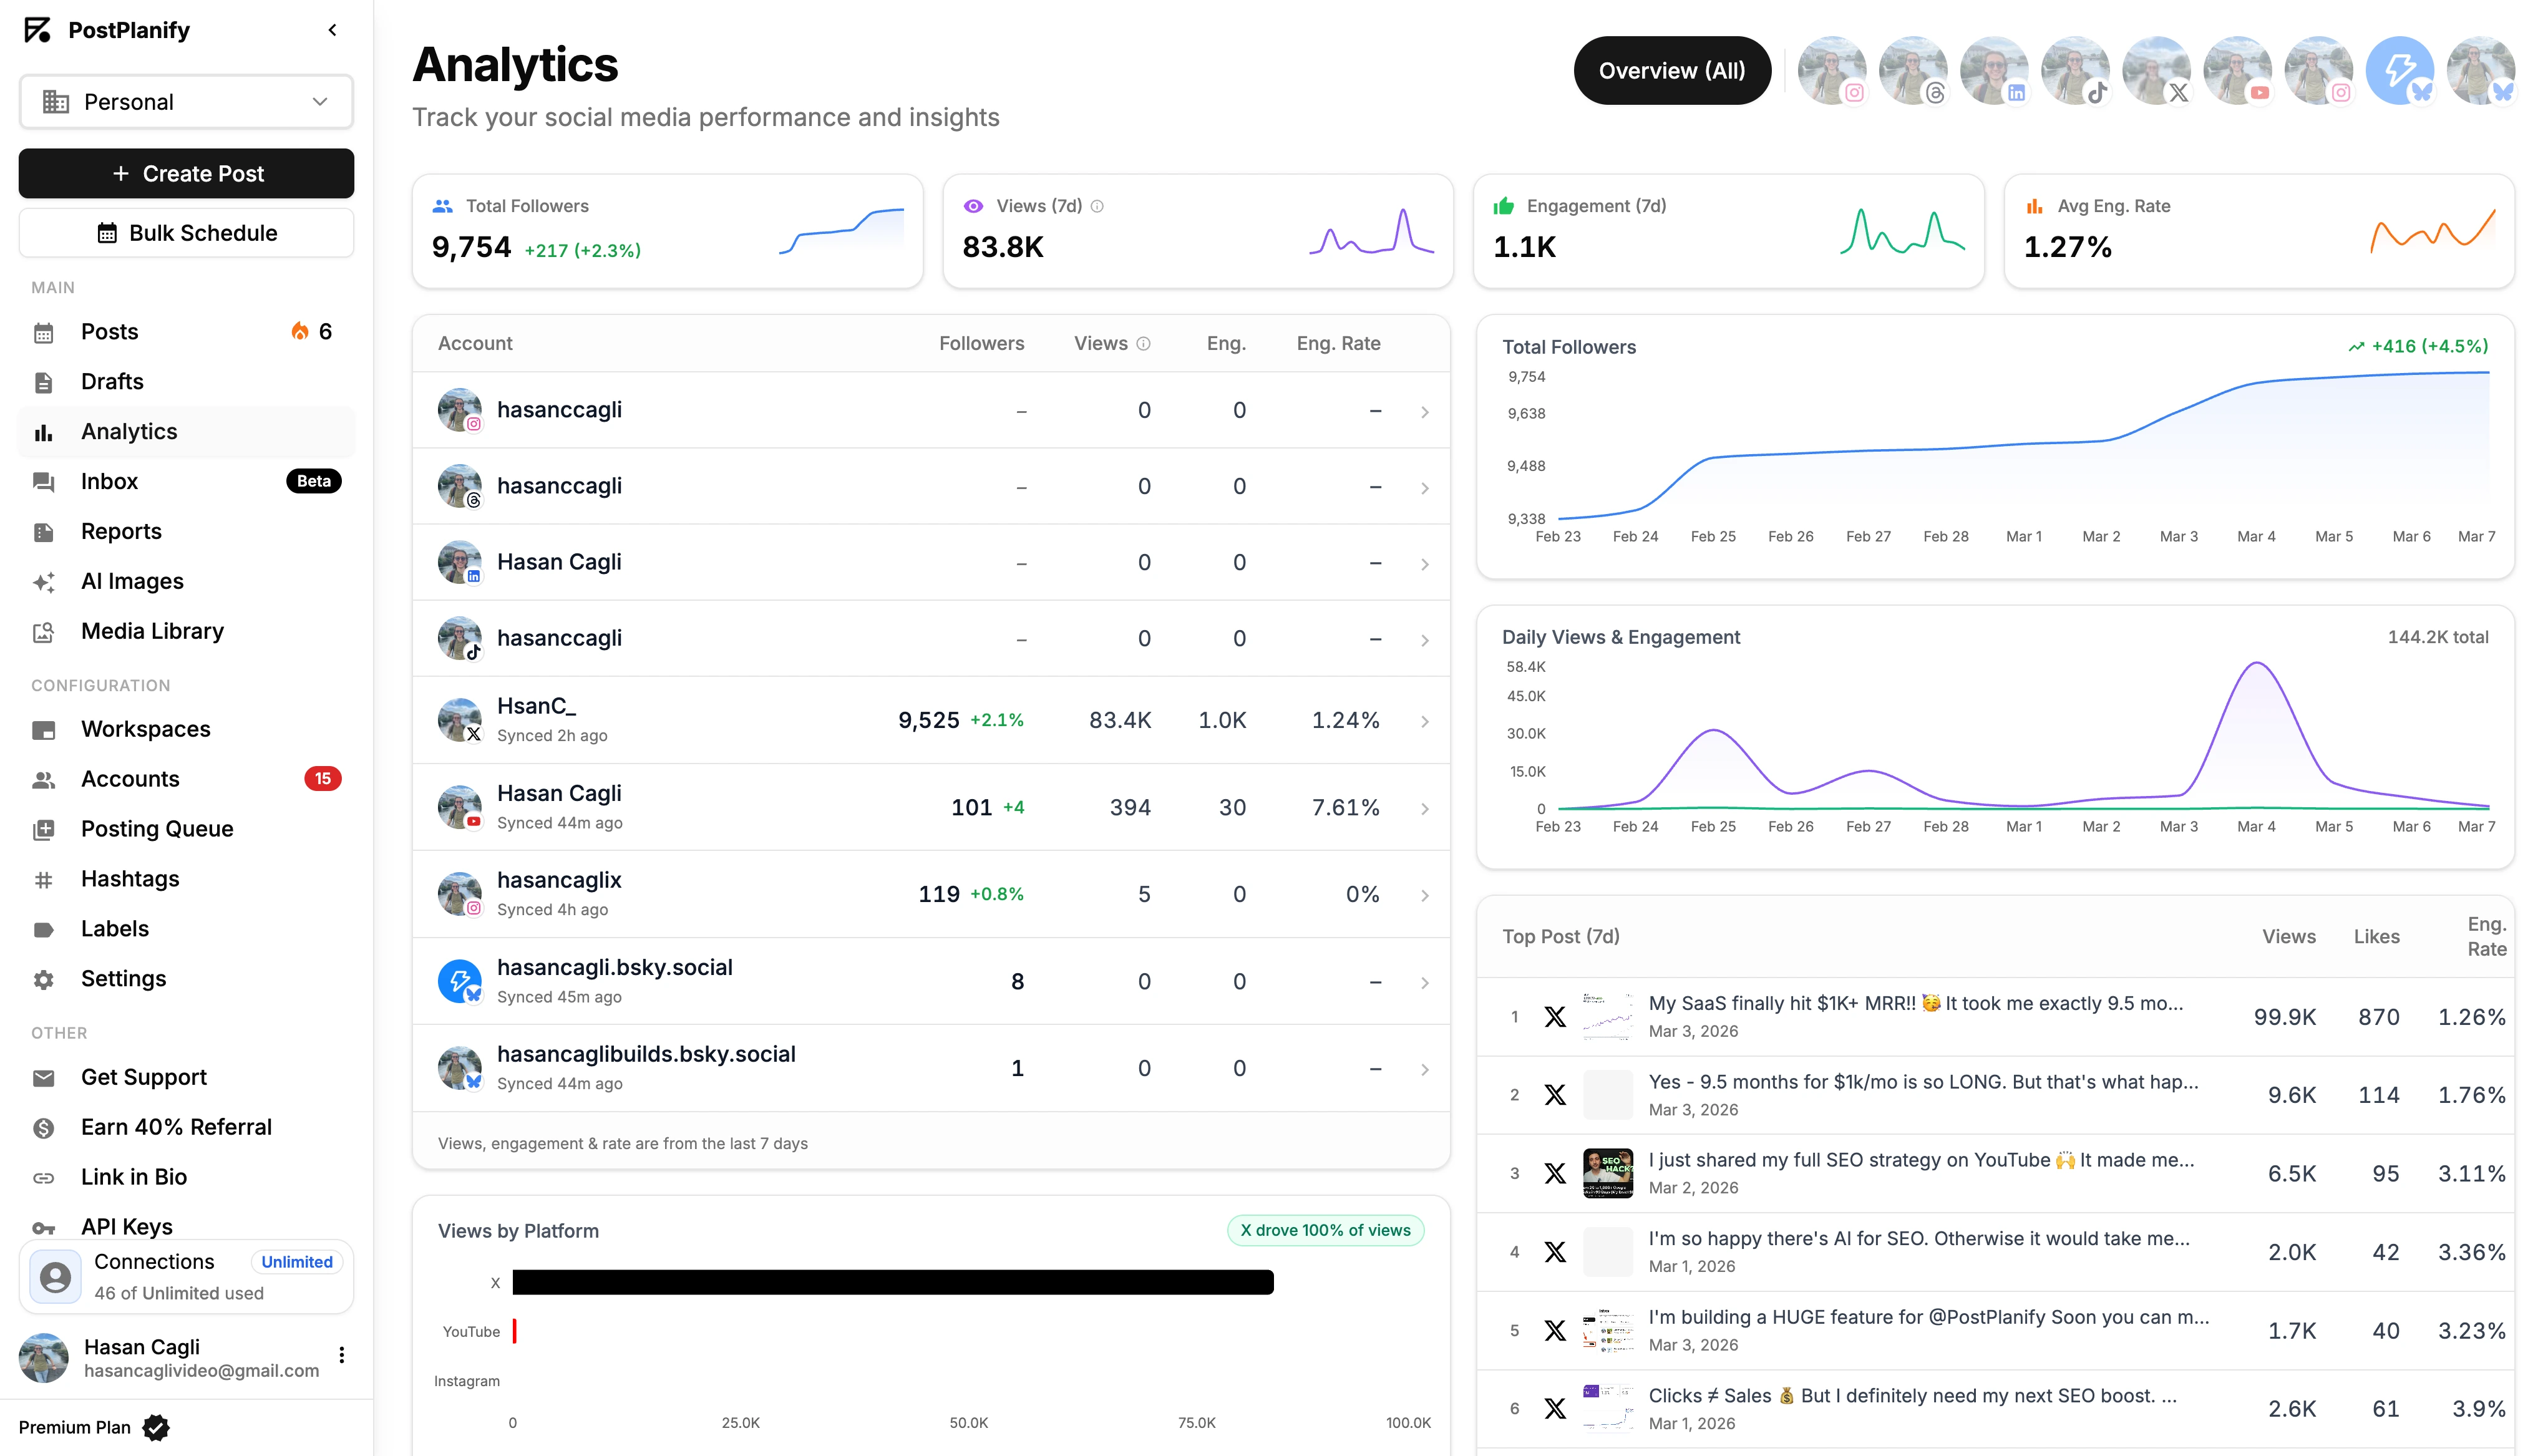
All your social media in one simple dashboard
Schedule posts, track analytics, and reply to comments/DMs — without switching tabs.

Engagement
+18%
Views
52.8k
When to Focus on Views or Impressions for Your Campaign
Choosing to optimize for views or impressions is a strategic decision that depends entirely on your campaign goal. If you chase the wrong metric, you’ll end up with misleading reports and wasted effort. Stop asking which metric is "better" and start asking which one proves you're achieving your business objective.
This decision shapes your content creation. A focus on impressions means you're creating for broad, top-of-funnel awareness. A focus on views means you're committing to creating valuable, engaging content that holds attention.
Prioritize Impressions for Brand Awareness and Reach
You should focus on impressions when your goal is maximum visibility. This is the right KPI when you need to get your brand, product, or message in front of as many people as possible, as often as possible. Impressions tell you how effectively the algorithm is distributing your content.
Focus on impressions for:
- New Product Launches: The goal is to make people aware the product exists. High impression volume ensures your launch message blankets the feed.
- Entering a New Market: When you're new, you need to build familiarity quickly. Impressions create that initial recognition.
- Major Brand Announcements: Pushing out news like a rebrand or a major partnership requires reaching the widest possible audience.
Real-World Scenario: An e-commerce brand launches a new sneaker. They run a campaign with visually striking images and short, looping videos. Their primary KPI is impressions. They need to build name recognition and make the design memorable before they can expect clicks or sales. Their content is designed to be easily digestible in a quick scroll.
Prioritize Views for Engagement and Education
You should focus on views when your goal is to capture genuine interest and spark deeper consideration. A view is proof that someone stopped, watched, and absorbed your message. This makes it a much stronger signal of intent than a fleeting impression.
A high view count directly reflects your content's quality and relevance. You can learn more about connecting these metrics to business outcomes in our guide on how to measure social media ROI.
Focus on views for:
- Product Tutorials or Demos: If you're showing how to use a software feature, you need people to actually watch it. View duration and completion rate are more important than impressions.
- Educational Content: When sharing industry insights or a how-to guide, views confirm your content is valuable enough to consume.
- Lead Generation Campaigns: A view is a critical first step before someone will consider giving you their contact information. It indicates they are invested enough to learn more, making them a warmer lead.
The rise of short-form video has supercharged both metrics. In 2026, video content accounts for over 60% of all social media consumption, with platforms like TikTok, Instagram Reels, and YouTube Shorts generating a staggering 120 billion daily views combined. For social media managers using PostPlanify, this reinforces the need for a video-first content calendar. On Instagram alone, Reels achieve 36% more reach than carousels, giving both your impression and view counts a powerful boost. You can find more of these insights in the latest social media marketing statistics on newmedia.com.
Diagnosing Your Content Performance with Engagement Rates
High view and impression counts are vanity metrics if they don't lead to business results. A post can reach thousands of people and still completely fail. The key is to understand the relationship between how many people see your content and how many care enough to interact.
By analyzing engagement rates relative to impressions and reach, you can diagnose whether you have a content problem (your post is boring) or a distribution problem (the right people aren't seeing it). This is how you move from guessing to making targeted, effective changes.

Calculating KPIs That Matter
Stop using outdated engagement rate formulas (likes divided by followers). To get a true measure of content quality, you must measure engagement against the people who actually saw the post.
Use these two formulas for an accurate diagnosis:
- Engagement Rate per Impression:
(Total Engagements / Total Impressions) x 100 - Engagement Rate per Reach:
(Total Engagements / Total Reach) x 100
The first formula tells you how engaging your post was each time it was shown. The second tells you what percentage of unique people who saw it took an action. For a deeper dive, check out our guide on how to use a social media engagement rate calculator.
The Content Problem: High Impressions, Low Engagement
This is the most common and frustrating scenario. The algorithm is pushing your post out (high impressions), but no one is interacting. This is a classic sign of a content problem. Your content isn't compelling enough to stop the scroll.
Common Causes:
- Weak Hook: The first 3 seconds of your video or the first line of your caption failed to grab attention.
- Misleading Creative: Your thumbnail or headline promised something the content didn't deliver, causing users to immediately leave.
- No Clear Call-to-Action (CTA): You didn't tell people what to do next (e.g., "Comment below," "Save this post"), so they did nothing.
- Wrong Audience Targeting: Your content was pushed to people who have no interest in the topic.
Real-World Scenario: A SaaS company posts a Reel announcing a new feature. It gets 50,000 impressions but only 250 likes and 5 comments. The high impression count proves the algorithm gave it a chance. The terrible engagement rate proves the video itself was boring or confusing. The problem isn't distribution; it's the creative.
The Distribution Problem: Low Impressions, High Engagement
This is a much better problem to have. Your post has very low impressions, but the small group of people who saw it loved it. It has a high engagement rate per impression.
This is a clear signal of a distribution problem. Your content is effective, but the algorithm isn't showing it to enough people.
Actionable Fixes:
- Optimize Hashtags and Keywords: Your current tags might be too niche or too competitive. Research a better mix of broad and specific terms to reach new audiences.
- Adjust Your Posting Time: You might be posting when your audience is offline. The initial lack of engagement tells the algorithm the post isn't good, killing its reach. Use a scheduler like PostPlanify to analyze your account's peak activity times and post then.
- Boost the Post with Ad Spend: You have proven that the content resonates with an audience. Putting a small budget behind it to target a lookalike audience is a smart investment.
- Add a "Share" CTA: Edit the caption to explicitly ask your followers to share the post with someone who would find it valuable.
This relationship between visibility and engagement is critical. Even as Instagram’s viewership grew by 29% in 2025, the platform’s overall engagement rate stayed flat at a meager 0.48%. That proves more eyeballs don’t automatically lead to more interaction. In fact, while Instagram Reels get more views, carousels actually earn a median engagement rate of 6.90%—that’s about 109% more engagement per person reached. These findings, pulled from a study of over 52 million posts, drive home why you must track both metrics. Discover more insights from Social Insider’s 2026 media benchmarks.
Related: How to Improve Social Media Engagement | Social Media Engagement Rate Calculator Guide | How to Create a Social Media Report
All your social media in one simple dashboard
Schedule posts, track analytics, and reply to comments/DMs — without switching tabs.
Engagement
+18%
Views
52.8k
Actionable Strategies to Increase Your Views and Impressions

Knowing the difference between views and impressions is the first step. The next is taking specific, practical actions to increase them. Here are the exact tactics you can use to improve both metrics, tailored to your specific goals.
How to Boost Your Impressions
To increase impressions, you need to play the algorithm's game. Your focus should be on discoverability—giving platforms every reason to show your content to a wider audience beyond your current followers.
1. Implement a Tiered Hashtag Strategy
Hashtags are a direct line to content categorization and discovery. A lazy strategy will fail.
- Step 1: Combine Tiers. Don't just use popular tags. Mix broad, high-volume hashtags (e.g.,
#DigitalMarketing) with niche, community-focused ones (e.g.,#ContentStrategyTips). This allows you to compete for visibility in smaller ponds while also appearing in larger streams. - Step 2: Create a Branded Hashtag. Develop a unique tag for your brand (e.g.,
#PostPlanifyTips) to track user-generated content and build a community hub. - Step 3: Research Trending Topics. Use each platform's native tools (like Instagram’s search suggestions or TikTok’s Discover page) to find and incorporate relevant trending hashtags and audio to ride waves of existing interest.
2. Post at Peak Engagement Times
The first hour after you post is critical. A burst of early engagement signals to the algorithm that your content is high-quality, prompting it to push it into more feeds, thereby increasing impressions.
- Actionable Fix: Stop using generic "best time to post" guides. Your audience is unique. Use PostPlanify's analytics to identify when your specific followers are most active. Schedule your content for those peak windows to maximize initial traction. For platform-specific timing data, see our guides on the best time to post on Instagram, TikTok, and social media in general.
3. Create Content Designed for Sharing
Shares are the ultimate impression multiplier. Every time someone shares your post to their Story or sends it in a DM, you gain impressions from a new audience.
- Actionable Fix: Create content that people feel compelled to share.
- Informative Carousels: Break down complex topics into simple, savable slides.
- Relatable Memes: Use humor that speaks to your audience's specific pain points or inside jokes.
- Strong Opinion Posts: Share a controversial but well-argued take on an industry topic to spark discussion and shares.
How to Get More High-Quality Views
When your focus is on views, you're trying to capture and hold attention. This is about creating compelling content that stops the scroll and keeps people watching.
1. Master the 3-Second Hook
On platforms like Instagram, Facebook, and TikTok, you have less than three seconds to stop a user from scrolling. Your intro determines your view count.
- Step 1: Start with Immediate Motion. Static intros get scrolled past.
- Step 2: Use a Provocative Question or Bold Statement. For example: "Are you still making this marketing mistake?" or "This one AI tool saved me 10 hours a week."
- Step 3: Add On-Screen Text. A clear, bold text overlay instantly communicates your video's value, even with the sound off.
To get this right, you need to understand the platform algorithms. Our guide on the Instagram Reels algorithm offers a deeper dive.
2. Write Captions That Increase Watch Time
Your caption should work with your video to keep people watching. Use it to build curiosity and give viewers a reason to stick around.
- The "Spoiler" Tease: Hint at a key result you'll reveal at the end. For example: "I tested three different video hooks, and the winner increased views by 200%. The result is at the end."
- Storytelling Captions: Tell a complementary story in the caption that adds context, encouraging people to watch the video while they read.
3. Use Interactive Features
Platforms reward creators who use their native tools. Interactive features boost engagement signals and can increase watch time.
- Actionable Fixes:
- Instagram/Facebook: Add Polls, Quizzes, or "Add Yours" stickers directly to your Reels and Stories to encourage active participation.
- TikTok: Use Duets and Stitches to encourage other users to create content with your video, driving views back to your original post.
- YouTube: Configure your End Screens to promote another relevant video. This can create a binge-watching session, dramatically increasing your total channel views.
Related: Best Time to Post on Social Media | How to Create Engaging Social Media Content | Social Media Analytics for Business
All your social media in one simple dashboard
Schedule posts, track analytics, and reply to comments/DMs — without switching tabs.
Engagement
+18%
Views
52.8k
Troubleshooting Common Issues With Your Metrics
You check your analytics, and your heart sinks. Impressions have plummeted, video views are flat, and it feels like the algorithm has turned against you.
When metrics tank, the cause is often something specific and fixable. Before you overhaul your entire strategy, you need to troubleshoot the problem like a product expert.
Why Your Analytics Look Wrong (But Might Not Be)
Sometimes the problem isn't your content; it's a technical issue with the data itself. Before you panic, check for these common causes of wonky metrics.
-
API Delays: Third-party tools like PostPlanify pull data from social media APIs. These APIs can have reporting delays of several hours. The numbers in your dashboard might just be lagging behind what you see natively on Instagram. It's usually not wrong, just not real-time.
-
Account Type Mismatches: An Instagram Business account provides far more data than a Creator or Personal account. If you recently switched your account type, you may have lost access to certain historical analytics, making it look like data is missing. Ensure you are using a Business or Creator account for full access.
-
Platform-Side Bugs: It happens. A platform like Facebook or X might roll out an update that temporarily breaks analytics, causing numbers to freeze or display incorrectly. These issues are typically acknowledged and fixed by the platform within a few days.
How to Diagnose a Sudden Drop in Impressions
A sudden drop in impressions is alarming but also a clear signal that something has changed. Work through this checklist to diagnose the cause.
-
Check for Content Policy Violations or "Shadowbans". Did you post something that could be considered borderline? Even if a post wasn't removed, it could have been flagged, leading to a "shadowban" or severe reach limitation. Review the platform's community guidelines against your recent content. If you're on TikTok, our guide on how to fix being shadowbanned on TikTok has a full diagnosis checklist.
-
Review Recent Engagement Quality. Look at the comments on your last few posts. Are they spam and bots, or are real people having conversations? A drop in meaningful interactions tells the algorithm your content isn't resonating, so it shows it to fewer people.
-
Analyze Your Posting Consistency. Did you switch from posting daily to only once or twice a week? A sudden drop in frequency can kill your momentum. Consistency signals to the algorithm that you are a reliable creator.
-
Investigate Competitor Activity. Did a rival just launch a major campaign or post a viral video that's dominating the conversation in your niche? Sometimes, a dip in your impressions is due to your audience's attention being temporarily pulled elsewhere.
Frequently Asked Questions
Which Metric Is Better: Views or Impressions?
Neither is "better"—they just answer different questions. It all depends on your specific goal for that piece of content.
- Focus on impressions for brand awareness goals (e.g., product launches, announcements). The goal is to maximize visibility.
- Focus on views for engagement and education goals (e.g., product tutorials, how-to guides). The goal is to confirm your message was actually watched and absorbed.
The "best" metric is the one that proves you achieved your objective.
Can My Views Be Higher Than My Impressions?
Yes, this can happen with video content, and it's usually a great sign. An impression is typically counted once per user when the post is delivered to their screen. A view, however, can be counted every time the video is played, including replays.
If one person was so engaged that they re-watched your video five times, you could end up with 1 impression (or 1 reach) but 5 views from that single user. This is a strong signal that your content was highly compelling.
How Is Reach Different From Impressions?
This is the most common point of confusion. Here’s the simple fix:
- Reach: The number of unique people who saw your content. If 100 individuals see your post, your reach is 100. It measures the size of your audience.
- Impressions: The total number of times your content was displayed on a screen. If those 100 people saw your post three times each, your impressions would be 300. It measures the frequency.
In short: reach is how many unique people you connected with; impressions are how often your content was seen.
How Do These Metrics Affect My Engagement Rate?
Using views versus impressions as the denominator in your engagement rate calculation tells a different story.
- Engagement Rate per Impression = (Total Engagements / Total Impressions) x 100
- This formula often gives a lower percentage but provides a very honest measure of how engaging your content is every time it appears.
A post with a high view count will naturally have a higher engagement rate because the audience is already invested enough to watch—they are inherently more likely to interact. It's crucial to be consistent with which formula you use for accurate tracking over time.
Why are my Instagram impressions higher than my reach?
Because one person can see your post multiple times.
If 500 unique people see your post, your reach is 500. But if some of those people see it twice (once in their feed, once when a friend shares it to Stories), your impressions might be 700 or 800.
A big gap between impressions and reach means the algorithm is re-serving your content to the same audience rather than finding new people. If that gap is too wide:
- Diversify your hashtags
- Post at different times
- Test new content formats to reach fresh eyes
For more on tracking these numbers, see our guide on social media analytics for business.
Do impressions count if you don't click?
Yes. An impression is counted the moment your content appears on someone's screen — whether they engage with it or not. They don't need to click, like, comment, or even stop scrolling.
That's exactly why impressions alone don't tell you much about content quality. To understand if people actually cared, pair impressions with engagement rate.
A high impression count with near-zero engagement is a red flag that your content isn't resonating.
Why are my TikTok views so low all of a sudden?
TikTok's algorithm tests every video with a small initial audience first. If that group doesn't engage (watch to the end, like, comment, share), the video gets buried.
Other common causes:
- Off-peak posting times — your video launched when your audience was offline
- Flagged audio or hashtags — using restricted sounds or tags kills distribution
- Community guidelines violation — even minor flags can trigger a temporary shadowban
Check your recent content for any policy warnings, review your posting times, and look at your completion rate. If people are swiping away in the first second, your hook needs work.
Do views or impressions matter more for growing followers?
Views matter more.
A view means someone actually watched your content — a much stronger signal of interest than a passive impression. People follow accounts that create content worth watching, not content that just shows up in their feed.
Focus on:
- Increasing your average watch time
- Improving your completion rate
- Making the first 3 seconds impossible to skip
When viewers consistently watch your videos to the end, the algorithm pushes your content to more people, which naturally drives follower growth. For more strategies, check out how to improve social media engagement.
How do I see my impressions on Instagram?
You need a Professional account (Business or Creator). Here's how:
- Per-post: Go to any post → tap View Insights → impressions are listed under the reach section.
- Account-wide: Go to your profile → Professional Dashboard → Account Insights → Accounts Reached. This shows total impressions across all your content for a selected time period.
If you manage multiple accounts, a tool like PostPlanify pulls impressions from all your connected platforms into one dashboard — no need to check each app individually.
Are views and impressions the same on YouTube?
No — and the gap between them is bigger on YouTube than any other platform.
- Impression: counted when a video thumbnail is shown to a user (in their feed, search results, or recommendations).
- View: only counted after someone clicks that thumbnail and watches for roughly 30 seconds.
So you could have 10,000 impressions but only 1,000 views — that means your thumbnail got shown a lot but only 10% of people clicked and watched.
Your click-through rate (CTR) is the bridge between these two metrics. A healthy CTR on YouTube is typically 4-10%.
Key Takeaways Checklist
- Impressions = Seen. Measures how many times your content was displayed on screen. Use it to track brand awareness and algorithm distribution.
- Views = Watched. Measures how many times your video was played for a minimum duration. Use it to track content quality and audience interest.
- Reach = Unique People. Measures the actual size of your audience for a given post.
- Diagnose Performance:
- High Impressions + Low Engagement = Content Problem. Your hook or value prop is weak.
- Low Impressions + High Engagement = Distribution Problem. Your content is good but needs a push (better timing, hashtags, or a small ad spend).
- Know the Platform Rules: A "view" on TikTok (instant) is not the same as on YouTube (30 seconds). Don't compare them directly.
Ready to stop guessing and start making data-driven decisions? PostPlanify centralizes your analytics, making it easy to track both views and impressions across all your platforms in one dashboard. Start your free 7-day trial of PostPlanify today.
Also read: Best Social Media Analytics Tools | How to Create a Social Media Report | Social Media Analytics for Business | ROI on Social Media
Also read: Social Media Impressions | How to Measure Social Media ROI | How to Create a Social Media Report | Social Media Analytics and Reporting | How to Improve Social Media Engagement | Best Social Media Management Platform
All your social media in one simple dashboard
Schedule posts, track analytics, and reply to comments/DMs — without switching tabs.
Engagement
+18%
Views
52.8k
About the Author

Hasan Cagli
Founder of PostPlanify, a content and social media scheduling platform. He focuses on building systems that help businesses, agencies, and teams plan, publish, and manage content and social media more efficiently across platforms.


