
Agencies that cite numbers out-perform agencies that don't. The pitch deck with Rival IQ's all-industry engagement-rate median is more persuasive than the one that says "engagement is down across the board." The client report that frames response time against Sprout Social Index's 42%-expect-a-reply-within-60-minutes stat gets renewed faster than the one that just shows the team replied quickly.
This roundup collects 40 verified social media agency statistics for 2026, organized into 10 categories. Every number has a named source, a live URL, and a date. Where a stat comes from an older study but is still widely cited, we flag it as "industry baseline." Where aggregators have reported numbers that vendors haven't published directly, we flag that too. The goal is to give agency teams a single reference they can pull from when writing client reports, building proposals, or pitching new business — without accidentally citing fabricated or stale data.
All figures verified in April 2026. Primary sources include Rival IQ's 2026 Industry Benchmark Report, Socialinsider's 2026 Social Media Benchmarks, DataReportal's Digital 2026, Sprout Social Index 2025 and Q4 2025 Pulse, Hootsuite Social Trends 2026, Gartner's 2025 CMO Spend Survey, Metricool's 2025 State of AI in Social Media, HubSpot's 2025 CPL and CAC Benchmarks, Influencer Marketing Hub's 2026 Benchmark Report, eMarketer's 2026 social commerce forecast, IFA's 2025 Economic Outlook, Content Marketing Institute's B2B Content Marketing Report, and Gwi's 2025 Dark Social research.
How We Sourced These Statistics
Every stat in this article meets three criteria:
- Current. Data published in 2024, 2025, or 2026 where available. Stats older than 2023 are flagged as "industry baseline."
- Sourced. Named organization + report + URL. No blog quotes without provenance.
- Quality-flagged. Primary-survey data is noted. Aggregator reports (where a third party cites a vendor number) are noted. Industry-estimate data (figures that circulate widely but lack a single primary citation) is noted.
Where the same stat has been updated by a newer study, we cite the newer figure. Where older studies remain the most-cited (like IDC's B2B Social Buying Study or Sociabble's employee advocacy research), we retain them and flag the age.
Top 5 Stats Every Agency Should Know in 2026
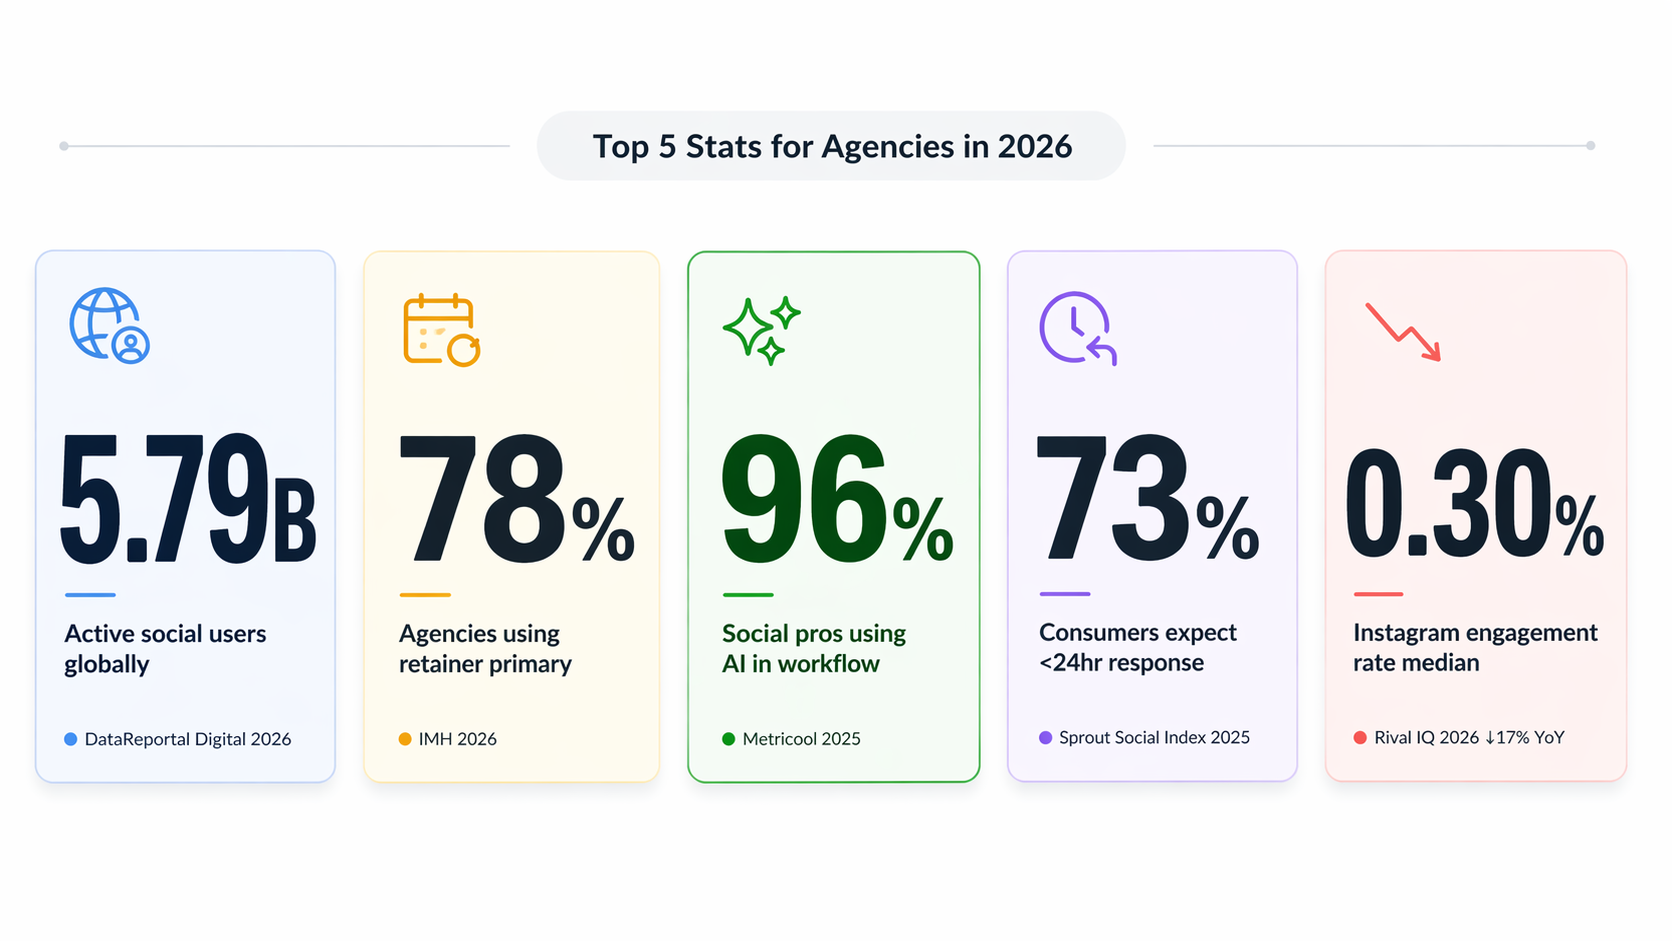
Before the full 40, the five stats that appear most often in 2026 agency pitches, client reports, and board decks:
- 5.79 billion people use social media globally — 69.9% of world population. (DataReportal Digital 2026)
- 78% of digital agencies use retainer as their primary pricing model — up from 64% in 2023. (Influencer Marketing Hub 2026)
- 96% of social media professionals now use AI in their workflow — 72.5% rely on AI tools daily. (Metricool 2025 State of AI in Social Media)
- 73% of consumers expect a response within 24 hours or sooner on social — 42% expect it within 60 minutes. (Sprout Social Index 2025)
- Rival IQ 2026 all-industry Instagram engagement rate median fell to 0.30% — down 17% year over year. (Rival IQ 2026 Industry Benchmark Report)
Category 1: Agency Industry Landscape & Market Size
The macro picture — how large the social media market is, how fast it's growing, and how many people live inside it.
1. The global social media market will reach $234.34 billion in 2026, up from $208.08 billion in 2025
A 12.6% year-over-year growth rate. The category includes social networks, publishing platforms, creator tools, and supporting services. (The Business Research Company, Social Media Global Market Report 2026)
2. The global social media management software market is projected at $39.14 billion in 2026
Projected to reach $164.52 billion by 2034 at a 19.70% CAGR. This is the segment that includes PostPlanify, Sprout Social, Hootsuite, SOCi, Sendible, and the rest of the tools agencies actually buy. (Fortune Business Insights, Social Media Management Market)
3. 5.79 billion people actively use social media globally
69.9% of the world's population — two out of every three humans. The number grew from 5.24 billion at the start of 2025, meaning roughly 550 million new social media identities emerged in 15 months. (DataReportal Digital 2026)
4. The average person spends 2 hours and 21 minutes on social media every day
For the ~5.79 billion users above, that totals roughly 14 billion hours of collective social media consumption per day. (DataReportal Digital 2026)
Category 2: Agency Pricing & Revenue Models
How agencies charge for work, which models dominate, and how pricing has shifted.
5. 78% of digital agencies use retainer as their primary pricing model in 2026 — up from 64% in 2023
The sharpest directional shift in agency-pricing data this decade. Per-project work generates more total revenue, but retainer is now the base model for most agencies. (Influencer Marketing Hub 2026, cited in InfluenceFlow Pricing Guide)
6. The average social media agency project runs $5,107.28 per month
Clutch's 2026 pricing directory data. Actual ranges span $500/month for small freelance engagements to $40,000+/month for enterprise multi-location work. (Clutch April 2026 Social Media Marketing Pricing Guide)
7. Project-based fees generate 50% of total agency revenue — more than any single model
Retainer is primary for most agencies but project fees (audits, campaigns, launches, specialty work) generate more total revenue than retainer at 44%. Hourly accounts for 30%, value-based 10%, commission/performance 1%. Totals exceed 100% because agencies use multiple models concurrently. (SoDA & Productive Agency Operations Survey)
8. 10–20% of ad spend is the industry-standard commission for agency-managed paid social
15–20% is the most-cited band across pricing sources. Tiered structures are common at scale — e.g., 15% up to $200K, declining to 11% at $300–400K, with further reductions at enterprise level. (Foxwell Digital, What Paid Social Agencies Charge)
Category 3: Agency Operations & Profitability
How agency teams are staffed and how much money they actually keep.
9. 46% of US marketing agencies employ 6–20 full-time staff
Agencies in the $1–10M revenue band run a median of 3 marketers on the social media team; $10–50M firms average 11; $50M+ shops jump to 26+. (Digital Applied 2026 Team Structure, aggregating IBISWorld)
10. Specialist social media agencies earn 25–40% profit margins; generalist agencies earn 15–20%
8-figure agencies maintain 25–32% margins vs. 18–22% for 7-figure agencies. The specialist premium matters — niche shops out-earn generalists per dollar of revenue. (Planable Agency Profitability Report 2026 and Predictable Profits 2025 Agency Growth Benchmark)
11. Retainer clients churn at 18% annually; project clients churn at 42%
The single biggest operational case for retainer-based pricing. Retainer clients stay an average of ~56 months; project clients average ~24 months. Both figures are industry benchmarks aggregated across agency ops reporting. (Focus Digital 2026 Agency Churn Report)
12. ~28% of top agencies now use hybrid pricing (retainer + performance bonus)
Described as "the fastest-growing pricing structure in the agency world." Typical structure: $3,000–$5,000/month retainer plus $250–$500 per qualified lead, or 5–8% base management fee + 3–7% performance bonus when targets hit. (Stackmatix Marketing Agency Pricing Models)
Category 4: Agency AI Adoption
The biggest operational shift of the 2020s — and still accelerating.
13. 96% of social media professionals now use AI in their workflow
72.5% rely on AI tools daily; only 3.6% don't use AI at all. This is a measurable shift from 2023, when most social teams were still experimenting rather than deploying AI in production. (Metricool 2025 State of AI in Social Media Report, survey of 900+ social-media professionals)
14. 54% of marketing leaders believe AI will empower them to grow social teams, not shrink them
The dominant narrative of "AI replaces marketers" is contradicted by the people managing marketing budgets. More than half expect AI to enable team expansion by handling grunt work and freeing senior staff for strategic work. (Sprout Social Index 2025, Edition XX)
15. 93% of social practitioners say AI helps alleviate creative fatigue
Content-generation volume is the single largest operational pressure on social teams. AI's caption-generation, image-variation, and brief-acceleration features reduce the marginal cost of producing more. (Sprout Social Index 2025)
16. 69% of consumers are comfortable with brands using AI for faster customer service
Updated from the 2025 Index's 75% figure based on Q4 2025 Sprout Pulse data. The percentage sits lower but still represents an acceptance majority — AI-assisted response is becoming the default consumer expectation. (Sprout Social Q4 2025 Pulse Survey)
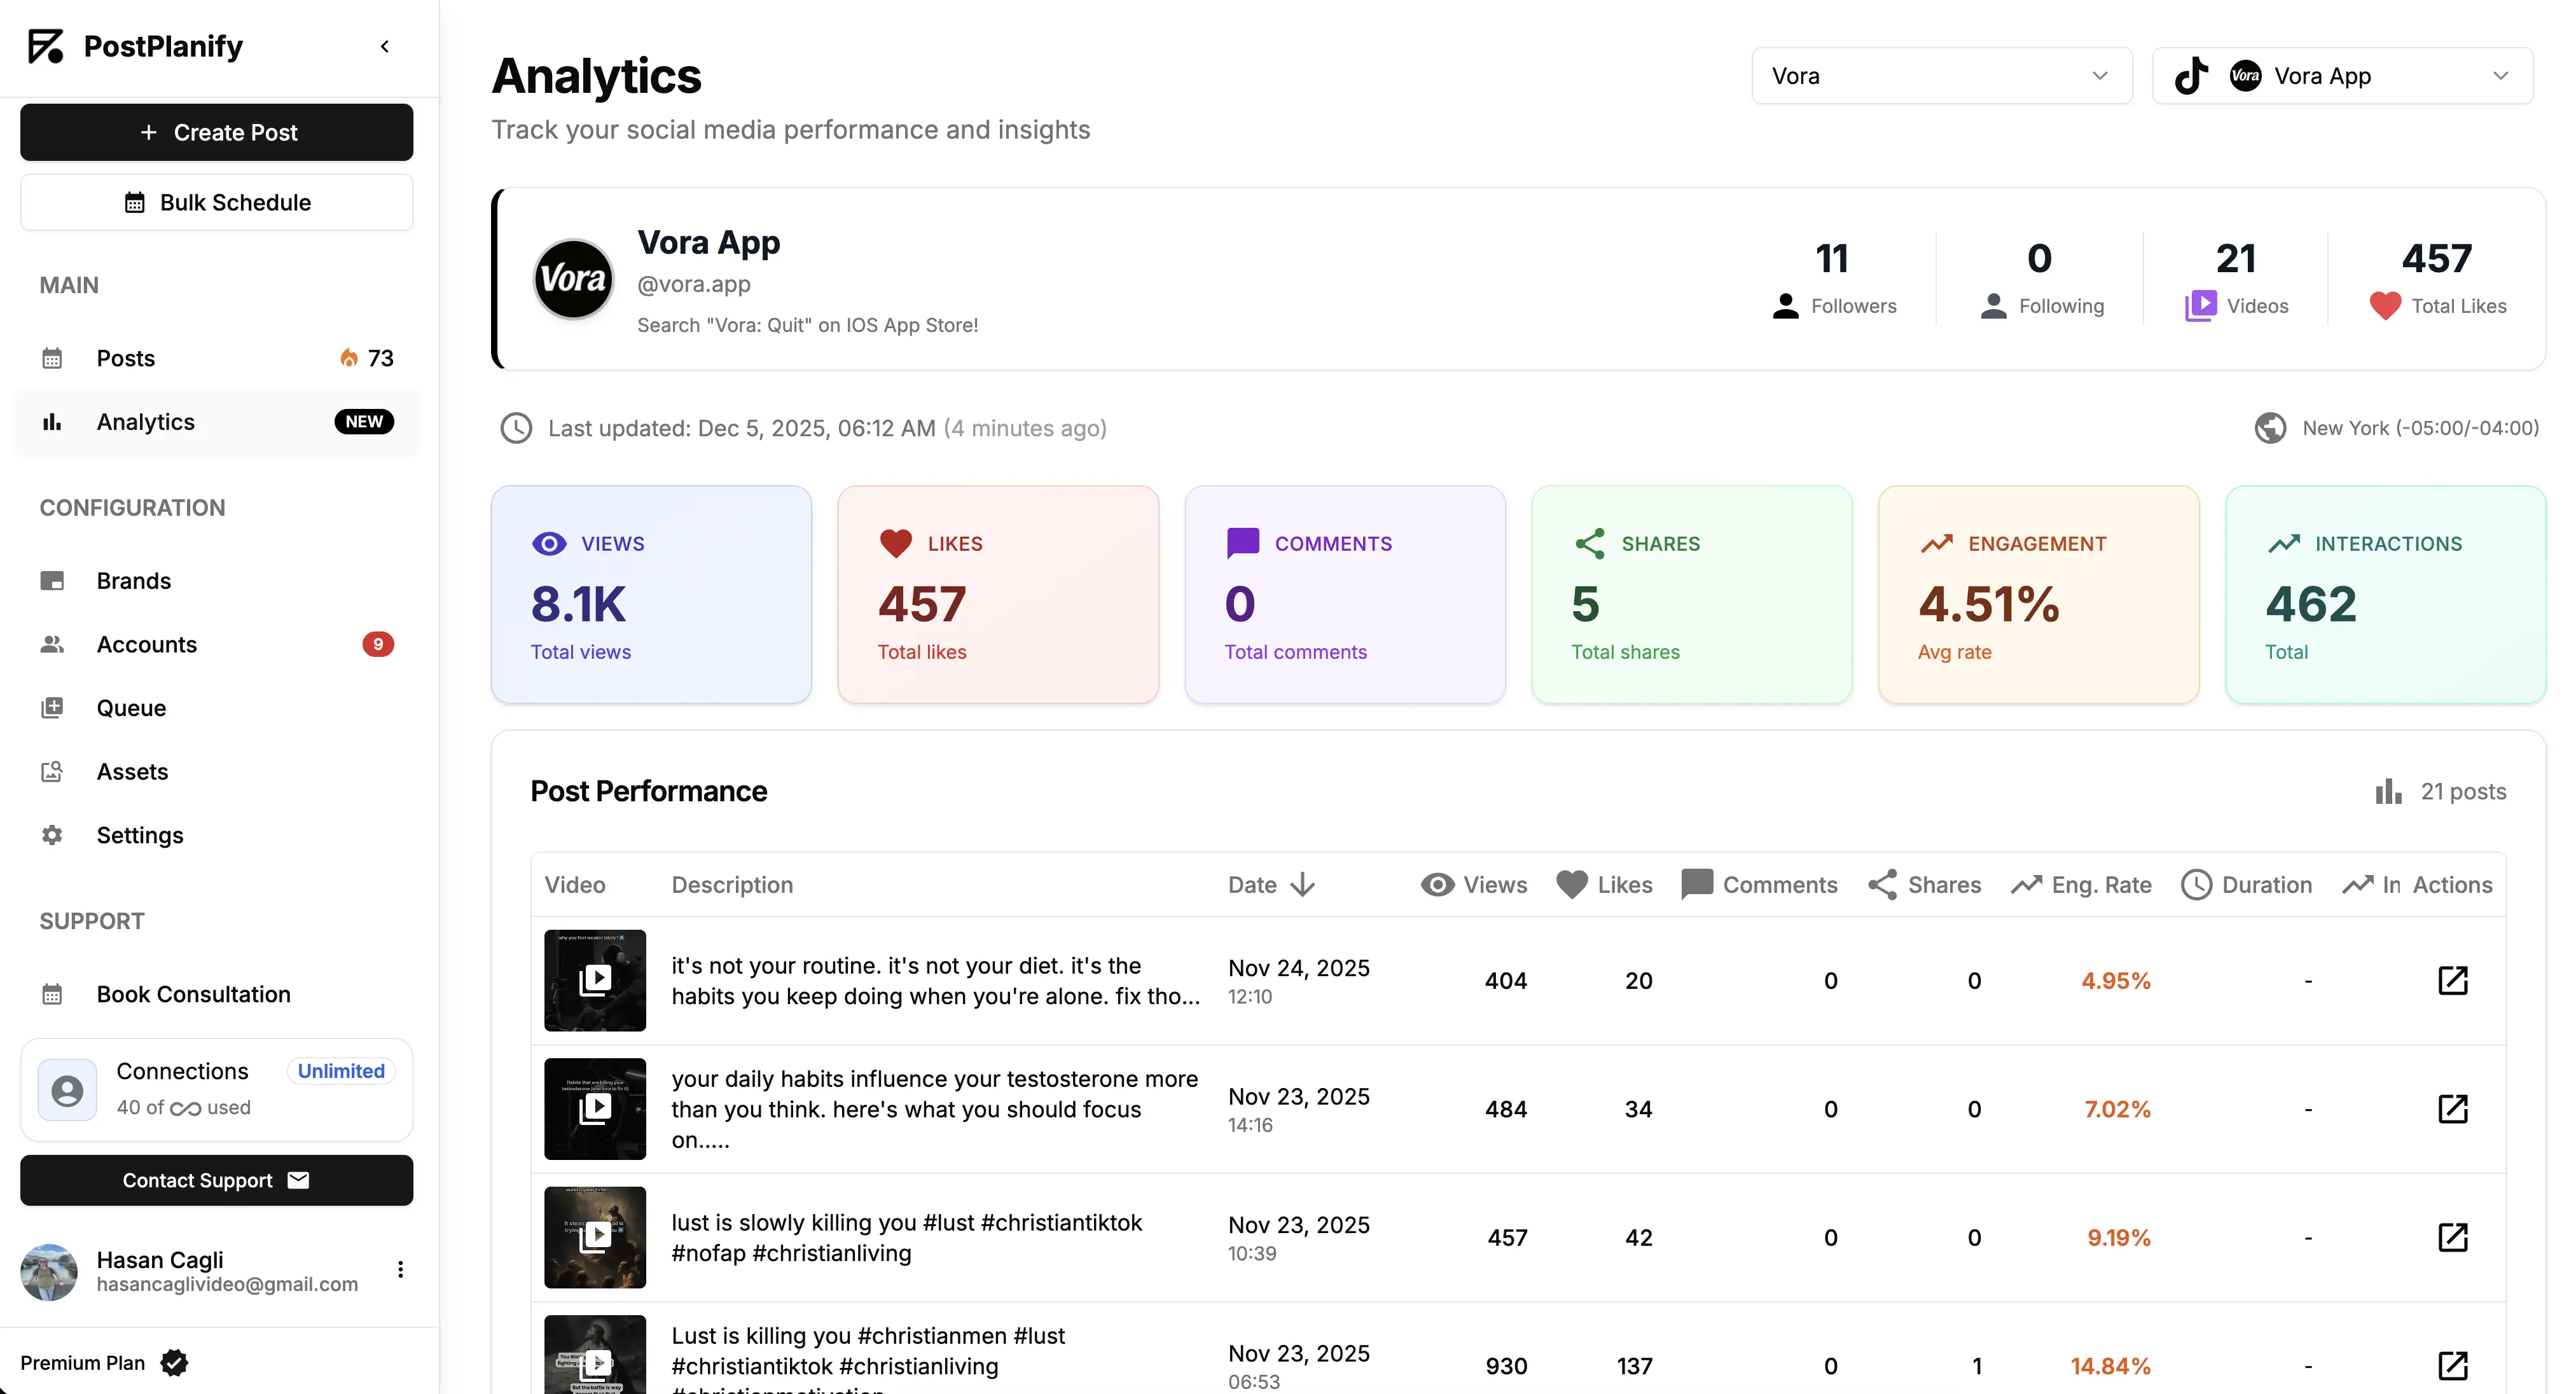
All your social media in one simple dashboard
Schedule posts, track analytics, and reply to comments/DMs — without switching tabs.

Engagement
+18%
Views
52.8k
Category 5: Agency New Business & Growth
How agencies win new clients and what it costs them.
17. Agency RFP / pitch win rates rose from 43% in 2024 to 45% in 2025
The largest year-over-year gain in five years. The driver: 68% of proposal teams now use AI in their response process, cutting proposal turnaround time and raising response quality. (Loopio 2026 RFP Response Trends & Benchmarks Report, 1,000+ respondents)
18. Customer acquisition cost jumped 40–60% across channels between 2023 and 2025
A direct consequence of rising ad costs, platform algorithm changes, and iOS tracking limitations. Agencies that haven't priced in CAC inflation are absorbing it as margin loss. (HubSpot 2025 CPL and CAC Benchmarks)
19. Average paid social CAC: $230 on Facebook, $982 on LinkedIn
The spread reflects intent quality: LinkedIn's higher CAC is offset by higher average deal values in B2B. Agencies should benchmark clients against platform-specific medians, not cross-platform averages. (HubSpot 2025 CPL and CAC Benchmarks)
20. 68% of proposal teams now use AI in their response process
From the Loopio 2026 survey. This tracks with the broader Metricool data — AI has moved from experiment to operational tool across agency functions, not just social content. (Loopio 2026 RFP Response Trends Report)
Category 6: Platform Engagement Performance (2026 Benchmarks)
What "good" looks like on each platform — and how rates are trending.
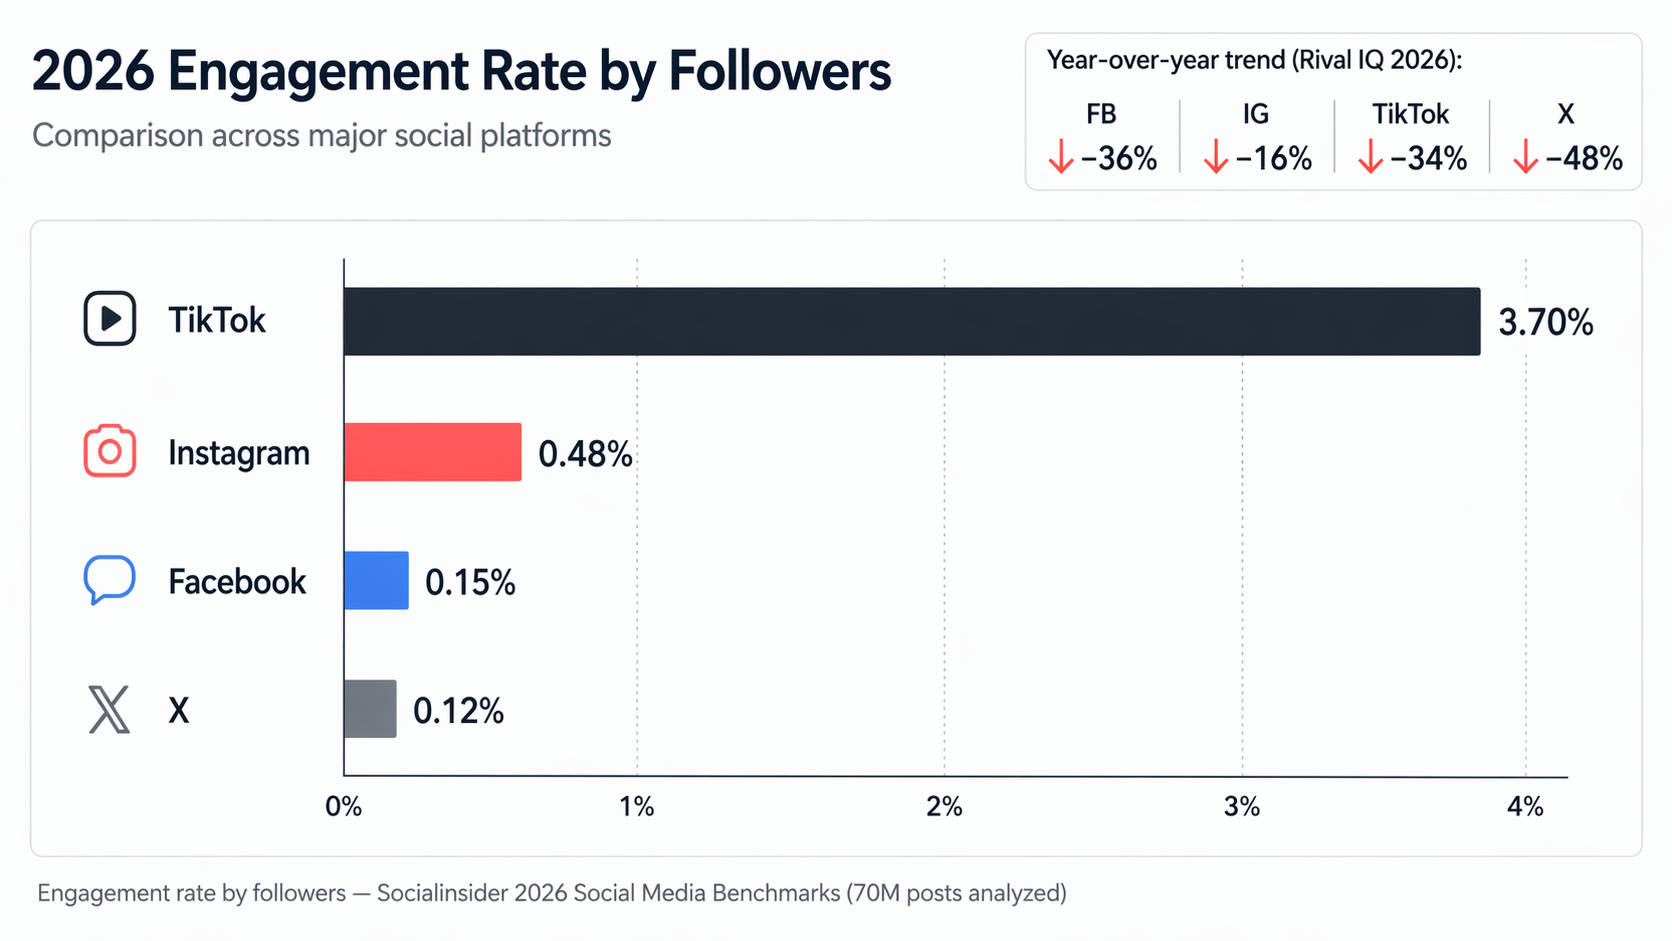
21. Engagement rate by followers (2026): TikTok 3.70%, Instagram 0.48%, Facebook 0.15%, X 0.12%
The Socialinsider 2026 benchmark based on 70 million posts analyzed in 2025. TikTok remains the highest-engagement major platform by a wide margin. Carousels lead Instagram engagement at 0.55%, beating Reels (0.52%) and static posts (0.37%). (Socialinsider 2026 Social Media Benchmarks)
22. Rival IQ 2026: Instagram all-industry engagement rate median fell to 0.30% — down 17% year over year
TikTok median sits at 2.01%; X median at 0.029%. Engagement rates have declined every year since 2022 as platform distribution algorithms favor broader reach over engagement depth. (Rival IQ 2026 Industry Benchmark Report)
23. Instagram's average reach rate is 3.5% of followers
Healthy ranges by account size: under 10K followers 8–15%, 10K–100K 5–10%, 100K+ 3–7%. For most branded accounts, reaching more than ~5% of your follower base on a given post is exceptional. (Socialinsider 2025 Social Media Reach Data)
24. Weekly follower growth rate by platform: TikTok 197.37%, Facebook 14.53%, Instagram 1.37%, LinkedIn 0.85%, X 0.00%
The TikTok figure is skewed by small-base accounts — established brand accounts typically grow 5–20% monthly, not weekly. For established Instagram accounts, sub-2% monthly is realistic. LinkedIn is the slowest-growing major platform for most brands. (Hootsuite 2026 Social Media Benchmarks)
Category 7: Consumer Behavior & Social Care
How audiences actually behave on social — which often differs from what brands assume.
25. 73% of consumers expect a response within 24 hours or sooner on social — 42% expect it within 60 minutes
One of the most stable benchmarks across the decade; Sprout Social has reported similar figures in every Index edition from 2022 onward. (Sprout Social Index 2025)
26. 73% of consumers will choose a competitor if their social inquiries go unanswered
The direct economic consequence of the response-time stat. A single ignored inquiry is, on average, a lost sale. (Sprout Social customer service statistics)
27. 63% of consumers now share content via "dark social" channels — DMs, WhatsApp, Messenger — vs. 54% who share on open feeds
20% share exclusively through private channels, meaning their engagement never shows up in public-facing metrics. Agencies that only measure likes/shares on feed posts miss the majority of sharing activity. (GWI The Rise of Dark Social, January 2025)
28. Gen Z spends 2.53 hours daily on TikTok, 1.93 hours on YouTube, and 1.87 hours on Instagram
41% of Gen Z turns to social-first for product research, outpacing the 32% who default to Google. The search-engine shift for the under-25 demographic is permanent. (eMarketer Gen Z Social Media Usage 2025 + Sprout Social Q2 2025 consumer survey)
All your social media in one simple dashboard
Schedule posts, track analytics, and reply to comments/DMs — without switching tabs.
Engagement
+18%
Views
52.8k
Category 8: Paid Social & Budget Allocation
Where brand marketing dollars actually go.
29. Global social media ad spend projected at $273 billion in 2026, $317 billion by end of decade
A slight deceleration from the 2020s hyper-growth years but still the largest digital ad category. US accounts for roughly 40% of total social ad spend. (Storyboard18 2026 Forecast aggregating Statista data)
30. Social advertising holds 12.2% of the average marketing budget in 2025
Overall marketing budgets sit flat at 7.7% of company revenue — the lowest share since Gartner began the survey. Digital channels as a whole account for 61.1% of total marketing spend. (Gartner 2025 CMO Spend Survey, survey of 402 CMOs)
31. Facebook Ads all-industry average ROAS = 2.19x; "healthy" ecommerce ROAS sits at 3x–5x
Industry breakdown: Automotive 2.54x, Sports & Outdoors 2.28x, Travel Accessories 2.25x top end. Media & Publishing lowest at 1.17x. Most US clients won't pay >10% of ad spend as agency fees above $500K/month in ad spend. (Focus Digital 2025 Facebook Ads ROAS Report)
32. Only 23% of social marketers currently use social data to measure ROI
The gap between "social drives outcomes" and "we prove it with data" is the single largest threat to social budgets in enterprise conversations. Agencies that close this gap justify higher retainers. (Sprout Social 2025 Social Media ROI Statistics)
Category 9: Short-Form Video & Creator Economy
The content formats and economic structures that grew fastest in 2025–2026.
33. 85% of marketers call short-form video the most effective social format; 77% say it delivers the highest ROI
Global ad spend on short-form video will reach $1.04 trillion in 2026 across all platforms — higher than total social ad spend because short-form content runs on YouTube, connected TV, and streaming platforms alongside social. (Marketing LTB aggregate of HubSpot + Wyzowl 2026 short-form video data)
34. The global influencer marketing industry hit $32.55 billion in 2025; projected at $40.51 billion in 2026
87.49% of brands plan to grow influencer budgets in 2026. Influencer spend is the fastest-growing line item within social budgets overall. (Influencer Marketing Hub Benchmark Report 2026)
35. Creator economy M&A activity hit 52 completed deals in H1 2025, up from 30 in H1 2024 — a 73% year-over-year jump
Holdco majors (Publicis, WPP) drove most capability buys as they build out in-house creator capability rather than outsource. Agencies specializing in creator work are being acquired faster than any other category. (Digiday Creator Economy M&A Boom 2025)
36. US social commerce sales will surpass $100.99 billion in 2026 — 7.2% of all US retail e-commerce
TikTok Shop alone is projected at $23.41 billion (+48% year over year), with 51% of US social buyers shopping on TikTok. Social commerce is no longer a subsegment — it's a primary retail channel. (eMarketer US Social Commerce Forecast 2026)
Category 10: Verticals — B2B, Franchise, and Multi-Location
Where social budgets concentrate and which agency verticals grow fastest.
37. 96% of B2B content marketers use LinkedIn; 80% of paid B2B social spend goes to LinkedIn
80% of B2B social-sourced leads come from LinkedIn. The platform's dominance in B2B is structurally unchanged despite volatility in organic reach. (Content Marketing Institute B2B Content Marketing Benchmarks)
38. 75% of B2B buyers use social media to support purchase decisions; 84% of C-suite / VP executives do the same
The IDC Social Buying Study is widely recirculated — note that the original research dates to 2014 and has been re-cited in every B2B social media piece since. It remains the most-cited figure in B2B social sales conversations. (IDC Social Buying Meets Social Selling via LinkedIn Sales Solutions) — flagged as aggregator-repeated, industry-baseline rather than fresh 2026 data
39. Employee-shared content earns roughly 8× more engagement than brand-channel content; employee networks are 10× larger than company follower bases
Edelman Trust Barometer data shows employee content is 3× more trusted than brand content. Employee advocacy is the single largest untapped reach multiplier available to most B2B agencies. (Sociabble Employee Advocacy Statistics + Edelman Trust Barometer) — base research dates to ~2020 Sociabble/MSLGroup study; industry-standard citation
40. 851,000 US franchise establishments projected in 2025, producing $936.4 billion in economic output
Franchising added ~213,000 jobs in 2025, surpassing 9 million total employees. 91% of consumers say local branch reviews impact their overall perception of big brands — meaning each individual franchise location's reputation feeds the master brand. (International Franchise Association 2025 Economic Outlook + BrightLocal Local Consumer Review Survey)
All your social media in one simple dashboard
Schedule posts, track analytics, and reply to comments/DMs — without switching tabs.
Engagement
+18%
Views
52.8k
Key Themes Across the Data
Seven patterns emerge when you read the 40 stats in sequence.
1. AI has moved from experiment to operational baseline. 96% of social teams now use AI in production (Metricool 2025). 68% of proposal teams use AI in new business (Loopio 2026). 93% of social practitioners say AI eases creative fatigue (Sprout Social 2025). The 2023–2024 question was "should we use AI?" The 2026 question is "which AI stack fits our workflow?"
2. Engagement rates are still declining, but the rate of decline is slowing. Rival IQ 2026 shows Instagram down 17% YoY to 0.30%; the 2025 report showed Instagram down 16% YoY from 2024. Agencies that baseline against older benchmarks overstate client underperformance.
3. Retainer is winning, but projects generate more total revenue. 78% of agencies use retainer as primary (+14 points since 2023), but project work still generates 50% of total agency revenue. The implication: most agencies now run a retainer-plus-project hybrid operationally, whether or not they name it that.
4. Dark social is now the majority of sharing. 63% of consumers share via DMs and private channels vs. 54% who share publicly. Social measurement that only counts public-feed engagement misses more than half of actual distribution.
5. Gen Z has shifted search behavior permanently. 41% of Gen Z starts product research on social, not Google. Search-engine optimization is becoming search-platform optimization — and social is one of the platforms.
6. Creator economy consolidation is accelerating. 73% YoY growth in creator-agency M&A in H1 2025. Specialist creator shops are being acquired faster than any other agency category.
7. Social commerce crossed the threshold from "promising" to "primary retail channel." $100.99 billion US social commerce in 2026 = 7.2% of all retail ecommerce. TikTok Shop alone at $23 billion. Agencies without a social commerce capability are losing ecommerce clients to those that do.
How to Use These Stats in Your Client Reporting
The practical framework for making these numbers work in proposals, reports, and board presentations.
In monthly client reports. Pick 2–3 stats that benchmark the client's performance against the industry. "Your Instagram engagement rate of 1.8% sits 6× above the Rival IQ 2026 all-industry median of 0.30%" reads better than "Your engagement is up." For the full reporting framework, see our 15 social media KPIs agencies should report to clients.
In new business proposals. Use industry-size stats ($234B global market, $39B SMM software market, 5.79B users) to frame scale. Use agency-operations stats (78% retainer primary, 28% hybrid adoption) to position your pricing model within market norms. For pricing conversations, see our social media agency pricing models guide.
In board or executive presentations. Lead with the three or four stats most tied to the client's business outcome. ROAS benchmark for ecommerce, response-time expectation for customer care, lead conversion rate for B2B. Avoid dumping 40 stats — pick the 3 that matter to the audience.
In content strategy meetings. Platform-specific stats (TikTok 3.70% ER, carousels beat Reels on IG at 0.55%, short-form video 85% most effective) inform creative direction. Pair with your client's own 90-day baseline.
In thought leadership and blog content. Cite the source inline every time. "5.79 billion people use social media (DataReportal Digital 2026)" builds credibility. "5.79 billion people use social media" without a source gets questioned.
Methodology Notes
A few data-quality flags worth highlighting so you can cite these numbers responsibly:
- IDC Social Buying Study (Stat #38) dates to 2014 and has been re-cited for over a decade. Still widely quoted but flag it as "industry baseline" when the audience values primary freshness.
- Sociabble / MSLGroup employee advocacy research (Stat #39) traces to a 2020 study. The 8× engagement / 10× reach figures are industry-standard citations rather than recent primary research.
- Rival IQ vs. Socialinsider engagement rate discrepancies (Stats #21 and #22) reflect different formula definitions. Rival IQ uses engagement rate per post by followers; Socialinsider uses the same formula but different post datasets. Cite both when accuracy matters; pick one when brevity matters.
- Credo hourly rate ($138/hr combined agency + consultant) baseline dates to a 2019/2022 survey. Credo's more recent PPC-specific refresh shows $136.85/hr global and $151.88/hr US — use the PPC number for paid-focused agencies, the combined number as baseline.
- Clutch $5,107.28 average monthly project cost (Stat #6) reflects Clutch's full agency directory including offshore freelance marketplace listings. Agency-only rates in major US metros run substantially higher.
- Hybrid pricing adoption (~28%, Stat #12) is an industry aggregation estimate, not a single primary survey. Cite as directional, not precise.
FAQ: Social Media Agency Statistics
What's the most important social media statistic for agencies in 2026?
Depends on context. For proving engagement relative to peers: Rival IQ's 2026 all-industry median of 0.30% Instagram engagement. For pricing credibility: the 78% retainer-primary adoption figure. For AI-readiness conversations: Metricool's 96% AI adoption among social pros. Pick the stat that matches the specific client question.
Are social media engagement rates really still declining?
Yes. Rival IQ 2026 shows Instagram down 17% YoY to 0.30%. 2025 saw declines of FB −36%, IG −16%, TikTok −34%, X −48%. The rate of decline is slowing but not reversing. Baseline against the 2026 number, not 2022–2024 benchmarks, to avoid overstating client underperformance.
Which platform has the highest engagement rate in 2026?
TikTok, by a wide margin — 3.70% engagement rate by followers (Socialinsider 2026), ~8× higher than Instagram's 0.48% and ~24× higher than Facebook's 0.15%. Rival IQ's 2026 figure for TikTok (2.01% industry median) uses a slightly different formula but confirms TikTok's lead.
How much should social media cost as a % of marketing budget?
The Gartner 2025 CMO Spend Survey reports social advertising at 12.2% of the average marketing budget. For comparison, digital channels as a whole account for 61.1% of total marketing spend. Total marketing budgets sit at 7.7% of company revenue — the lowest share in the survey's history.
How has agency pricing changed in the last 3 years?
Retainer adoption as the primary model rose from 64% (2023) to 78% (2026). Hybrid pricing (retainer + performance) grew to ~28% of top agencies. Commission on ad spend remains at 10–20% as the industry standard. Hourly rates have modestly increased. The biggest shift is structural — agencies consolidating around retainer-plus-performance hybrids rather than pure models.
What % of social media agencies use AI?
96%, per Metricool's 2025 State of AI in Social Media report. 72.5% use AI daily. Only 3.6% report not using AI at all. The question for 2026 isn't whether to adopt AI — it's which AI capabilities to add first.
Is TikTok still growing for B2B?
Yes, but slowly. B2B social spend concentration remains on LinkedIn (80% of paid B2B social budgets). TikTok has B2B pockets in tech, SaaS, and creator-economy-adjacent verticals, but LinkedIn's B2B dominance is structurally unchanged.
How do I know if a stat is still current?
Check the publication year. Stats from 2024–2026 are generally current. Stats from 2019–2023 are "industry baseline" — still cited but not fresh. Stats older than 2019 should be flagged when cited. Every stat in this roundup is flagged by year.
Can I use these stats in my client proposals?
Yes. Every stat has a named source and URL — cite both when you use the number. "5.79 billion people use social media (DataReportal Digital 2026)" is the pattern. Don't strip the source for cleaner formatting; it's the attribution that makes the number credible.
What's the biggest threat to social media agencies in 2026?
Three tied threats: (1) Creator-economy consolidation — holdco majors are acquiring specialist creator shops faster than new ones can form. (2) AI-enabled in-house teams — brands using AI to reduce agency dependency on content creation. (3) Engagement-rate decline making client ROI harder to prove — agencies that can't attribute social to revenue will lose to those that can. Counter-positioning: niche specialization, proven attribution, and hybrid pricing that aligns agency incentive with client outcome.
What's the biggest opportunity in 2026?
Social commerce ($100.99B US, +48% TikTok Shop growth), AI-augmented service delivery (56% faster turnaround at same margin), and short-form video production (77% of marketers say highest ROI, $1.04T global short-form ad spend). Agencies building capability in these three areas are outgrowing the industry average.
How often should I update my stats library?
Quarterly. Rival IQ publishes its Industry Benchmark annually. Socialinsider publishes annually. Sprout Social publishes the Index annually plus quarterly Pulse surveys. Hootsuite's Social Trends is annual. Gartner's CMO Spend Survey is annual (May). Setting a quarterly review cadence keeps citations fresh without the overhead of real-time updating.
Are there stats specifically for franchise or multi-location brands?
Yes. IFA 2025: 851,000 US franchise establishments, $936.4B output. BrightLocal: 91% of consumers say local branch reviews impact master-brand perception. Google hosts 73% of all online business reviews. Full deep-dive in our best social media tools for multi-location brands guide.
Do these stats apply to agencies outside the US?
Mostly yes, with caveats. Global stats (DataReportal, Rival IQ, Socialinsider, Influencer Marketing Hub) apply broadly. Agency-pricing stats (IMH, Clutch, Dollarpocket) are US-weighted — non-US markets typically see 30–60% lower hourly rates per Clutch's geographic bands. Consumer behavior stats (Sprout Social) skew US. For regional benchmarks, regional vendor reports (GWI for EMEA, Sprinklr for APAC) are cleaner sources.
What's the best stat to anchor a client audit?
Pair two: (1) the client's own 90-day baseline performance, and (2) the Rival IQ 2026 or Socialinsider 2026 platform benchmark for their industry. Gap analysis — "you're X% above/below industry median on your primary platform" — is more actionable than standalone numbers. Full audit framework in our social media audit template.
Key Takeaways
- 40 verified stats across 10 categories. Each has a named source, URL, and date. Cite inline when you use them.
- AI has moved from experiment to operational baseline. 96% of social teams use AI (Metricool 2025). Frame AI in proposals as table-stakes, not differentiator.
- Retainer is winning, but projects generate more total revenue. 78% primary retainer adoption, but 50% of agency revenue still comes from projects. Most agencies now run hybrids whether they name them that or not.
- Engagement-rate decline continues. Rival IQ 2026: IG down 17% YoY to 0.30%. Benchmark clients against 2026 numbers, not 2023–2024.
- Dark social is now the majority of sharing. 63% share via DMs. Measurement that only counts feed engagement misses most of the story.
- Social commerce crossed the threshold. $100.99B US in 2026, TikTok Shop +48% YoY. Ecommerce-focused agencies without social commerce capability are losing.
- Creator-agency consolidation is accelerating. 73% YoY M&A growth. Specialist positioning is the defense.
- Flag your data quality honestly. "Industry baseline," "aggregator estimate," and "primary 2025/2026 survey" are not the same thing. Transparency builds credibility; fabrication destroys it.
All your social media in one simple dashboard
Schedule posts, track analytics, and reply to comments/DMs — without switching tabs.
Engagement
+18%
Views
52.8k
The agencies that win in 2026 aren't the ones with the biggest budgets or the most junior talent. They're the ones who can frame a client conversation in numbers that Google, LinkedIn, and the C-suite all recognize. This list is the raw material. Pair it with client-specific data, source every figure, and update quarterly.
Related Reading
- How to Start a Social Media Marketing Agency
- How Social Media Agencies Use AI in 2026: 15 Workflows
- The 15 Social Media KPIs Every Agency Should Report to Clients
- Social Media Agency Pricing Models Compared
- The 15-Step Social Media Agency Client Onboarding Checklist
- Best Social Media Tools for Managing Multiple Brands
- Best Social Media Tools for B2B Companies
- Best Social Media Tools for Multi-Location Brands
- Best Social Media Management Tools for Agencies
- Best Social Media Analytics Tools
- Social Media Analytics and Reporting
- How to Create a Social Media Report
- Social Media Audit Template
- ROI on Social Media
- How Much to Charge for Social Media Management
- Client Engagement Metrics That Matter
- Views vs. Impressions: Explained
- Social Media Engagement Rate Calculator Guide
- White-Label Social Media Reports for Clients
- Save Time on Social Media Management
All your social media in one simple dashboard
Schedule posts, track analytics, and reply to comments/DMs — without switching tabs.
Engagement
+18%
Views
52.8k
About the Author

Hasan Cagli
Founder of PostPlanify, a content and social media scheduling platform. He focuses on building systems that help businesses, agencies, and teams plan, publish, and manage content and social media more efficiently across platforms.


