
Most agency-client relationships don't fail because the work was bad. They fail because the reporting was incoherent. Follower counts and impressions sat in the monthly deck. The primary business outcome — qualified leads, revenue, retention — went untracked. By month four, the client started asking why they were paying for "likes."
This is the definitive list of the 15 social media KPIs every agency should report to clients in 2026. Each section includes the definition, the formula, the current published benchmark with source, platform-specific nuances, how to present the metric to clients, common reporting mistakes, and per-platform improvement tactics. Every benchmark is sourced from Rival IQ, Socialinsider, Sprout Social Index, Hootsuite, Unbounce, Similarweb, or Kaushik's original framework. Where no credible public benchmark exists, the article says so directly rather than fabricating a number.
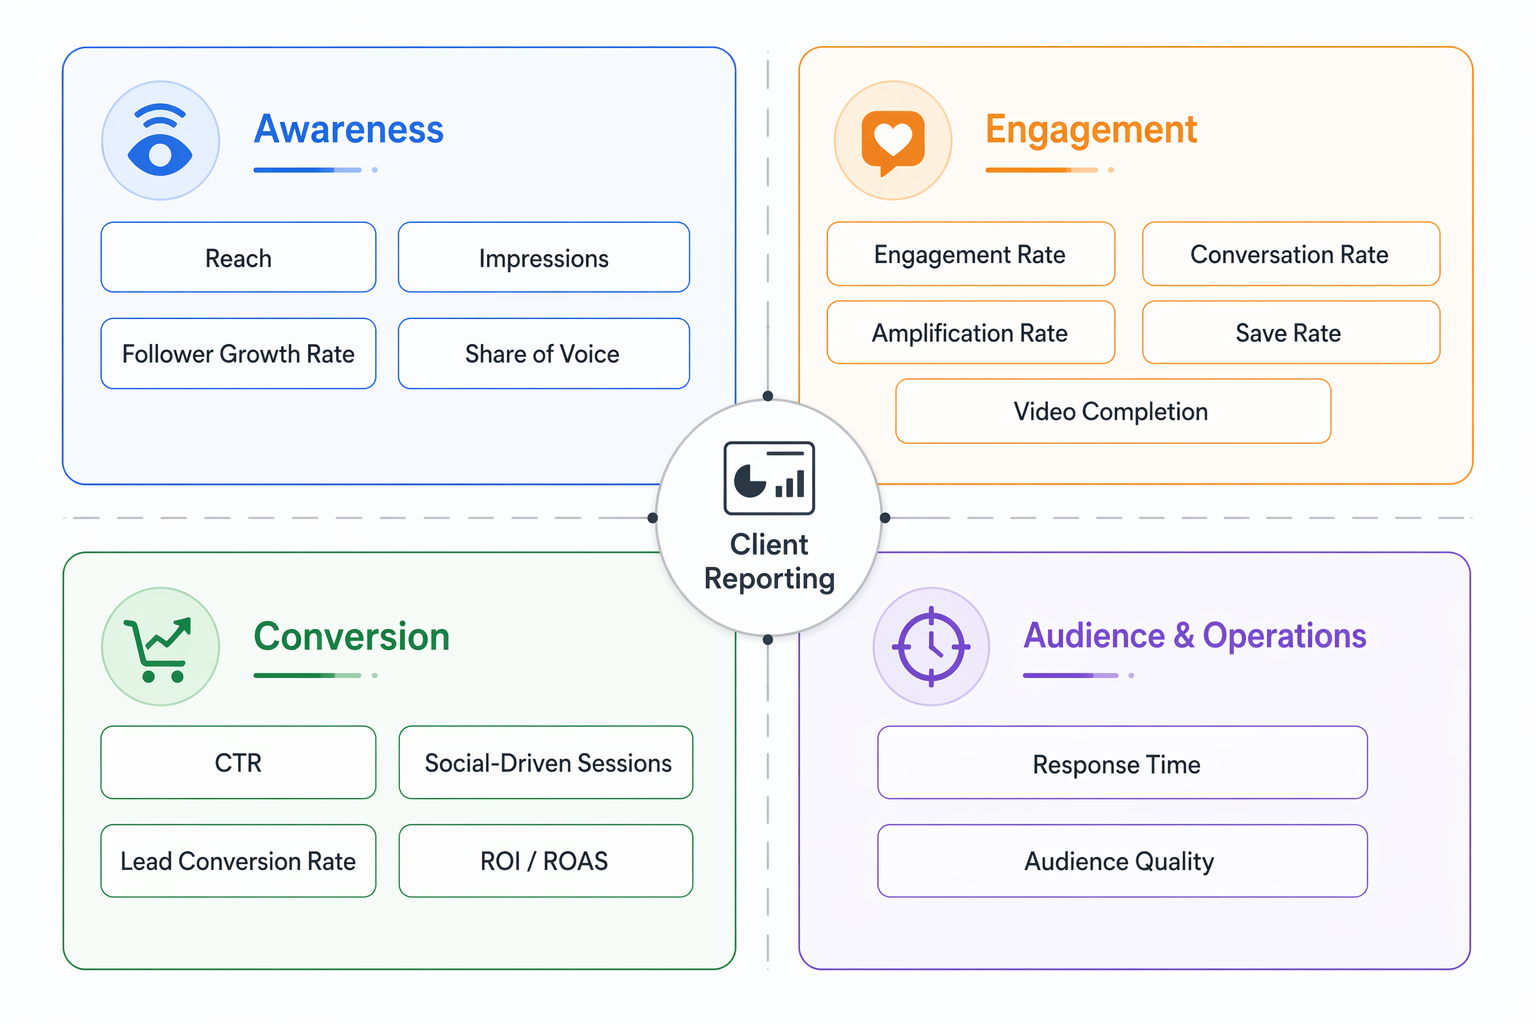
The 15 KPIs are grouped into four buckets — Awareness, Engagement, Conversion, and Audience & Operations. The bucket structure matters because reporting strength comes from balance. Reach without engagement signals weak creative. Engagement without conversion signals misfit audience. Conversion without audience fit signals short-term wins that won't compound. One KPI from each bucket, organized around the client's primary objective, is the difference between a report that renews retainers and one that gets questioned.
Quick Answer: Which KPIs Should an Agency Report to Clients?
Every agency client report should include one primary KPI tied to the client's main business objective, plus 3–5 supporting KPIs spread across the four buckets below. Reporting on 15 metrics every month overwhelms clients; reporting on only one makes the agency look shallow. The discipline is picking the right 5–7 for a given engagement.
The 15 KPIs organized by bucket:
- Awareness (4): Reach, Impressions, Follower Growth Rate, Share of Voice
- Engagement (5): Engagement Rate, Conversation Rate, Amplification Rate, Save Rate, Video Completion Rate
- Conversion (4): Click-Through Rate, Social-Driven Website Sessions, Lead Conversion Rate, Social Media ROI/ROAS
- Audience & Operations (2): Response Time, Audience Quality
For a lead-generation client, the primary KPI is usually Lead Conversion Rate, supported by CTR, Social-Driven Sessions, and Engagement Rate. For a brand-awareness client, the primary KPI is usually Share of Voice, supported by Reach, Follower Growth Rate, and Amplification Rate. For a community-led client, the primary KPI is usually Engagement Rate, supported by Response Time, Conversation Rate, and Save Rate.
At a Glance: The 15 KPIs, Formulas, and Benchmarks
| # | KPI | Bucket | Formula | 2026 Benchmark |
|---|---|---|---|---|
| 1 | Reach | Awareness | Unique accounts that saw the content | ~3.5% of followers on Instagram (Socialinsider) |
| 2 | Impressions | Awareness | Total content displays | Tiered by account size (see section) |
| 3 | Follower Growth Rate | Awareness | (New followers / starting followers) × 100 | 1.37%/week Instagram, 0.85% LinkedIn (Hootsuite) |
| 4 | Share of Voice | Awareness | Your mentions / total category mentions × 100 | No universal number — measured relative to competitor set |
| 5 | Engagement Rate (by followers) | Engagement | Total engagements / followers × 100 | TikTok 3.70%, Instagram 0.48%, Facebook 0.15%, X 0.12% (Socialinsider) |
| 6 | Conversation Rate | Engagement | Comments per post / followers × 100 | No universal benchmark (Kaushik framework) |
| 7 | Amplification Rate | Engagement | Shares per post / followers × 100 | No universal benchmark (Kaushik framework) |
| 8 | Save Rate | Engagement | Saves per post / reach × 100 | No universal rate; raw saves tier by account size |
| 9 | Video Completion Rate | Engagement | Completed views / total views × 100 | ~65–78% across short-form platforms (aggregator data) |
| 10 | Click-Through Rate (CTR) | Conversion | Clicks / impressions × 100 | LinkedIn organic ~0.22% (sparse public data) |
| 11 | Social-Driven Website Sessions | Conversion | Sessions from social / total sessions × 100 | ~7% of total traffic average (Similarweb) |
| 12 | Lead Conversion Rate | Conversion | Leads / landing page visits × 100 | 1.5% from social (Unbounce); 6.6% all-channel median |
| 13 | Social Media ROI / ROAS | Conversion | (Revenue − spend) / spend × 100 | Facebook Ads avg ROAS 2.19x (Focus Digital) |
| 14 | Response Time | Audience & Ops | Avg time to first reply on comments/DMs | 73% of consumers expect <24hr, 42% <60min (Sprout Social Index) |
| 15 | Audience Quality | Audience & Ops | Qualitative score: ICP match %, bot %, engagement sanity | No universal benchmark — framework only |
Why Most Agency Client Reports Fail
Before the 15 KPIs, a frank look at why reporting goes wrong in practice. Most of these are fixable without new tooling.
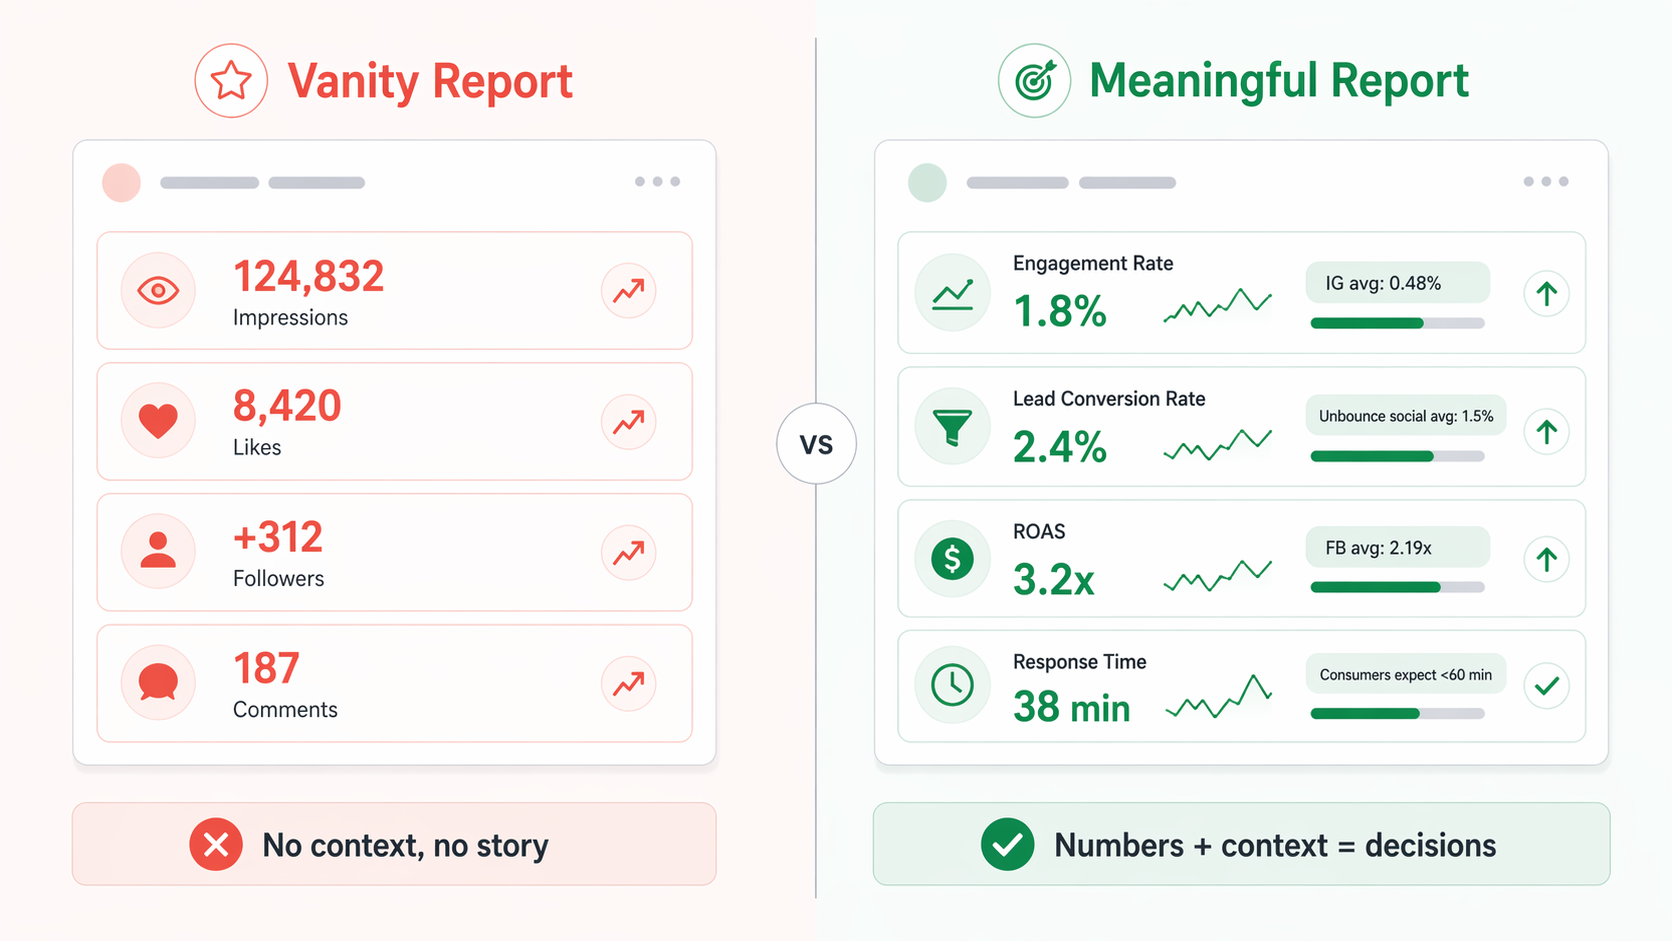
- Vanity metrics dominate. Follower count, total likes, "accounts reached" without context. These numbers go up and down without explaining whether the account is actually earning qualified attention.
- One primary KPI never gets picked. Agencies report 12–20 metrics every month, hoping quantity signals rigor. Clients want to know: did the needle move, yes or no, on the one number that matters.
- Benchmarks are missing. A 2% engagement rate means nothing on its own. Against a Facebook average of 0.15%, it's excellent. Against TikTok's 3.70%, it's below average. Without benchmarks, clients can't interpret numbers.
- Reports are retrospective only. Good reports answer three questions: what happened, why, what's next. Most agency reports answer only the first. The client leaves not knowing what the agency is going to do differently.
- Platform definitions aren't explained. Instagram "Views" is not the same as Facebook "Views" is not the same as X "Impressions." When agencies don't disclose which metric they're citing, clients lose trust the first time the numbers don't line up with their own checking.
- Conversion attribution is sloppy. Social-assisted conversions get credited entirely to the last click (usually search or direct), making social look worse than it is. Without assisted-conversion reporting, agencies under-sell their actual impact.
- The report stops at channel data. Strong reports tie social performance to business outcomes the client actually cares about — pipeline velocity, average order value, retention cohorts. Most agency reports never leave the platforms.
The 15 KPIs below are organized to close these gaps. Each section includes how to present the metric to clients, which is where most agencies drop the ball.
How We Picked These 15 KPIs
This list is not a random aggregation. Each KPI satisfies three filters:
- It maps to a business outcome a client cares about. No metric survives because it's easy to pull; every metric here can justify its place in a monthly report.
- It has either a credible published benchmark or a defensible framework. Where a public benchmark exists (Rival IQ, Socialinsider, Sprout Social Index, Hootsuite, Unbounce, Similarweb), we cite it with source and URL. Where it doesn't, we flag that directly instead of inventing numbers.
- It's reportable from platform-native analytics or a unified tool. No KPI here requires proprietary data that only large enterprises have access to.
The four-bucket framework (Awareness, Engagement, Conversion, Audience & Operations) is adapted from standard marketing-funnel practice. It's also how tools like PostPlanify and Rival IQ group metrics in their default dashboards, which means agencies reporting in this structure can build directly from the tool layout without manual reorganization.
For more on structuring the full monthly client report around these KPIs, see our guides on how to create a social media report and social media analytics and reporting.
The 15 KPIs in Detail
1. Reach
Definition. Reach is the number of unique accounts that saw a post. It's the closest social metric to "actual audience exposure." One person seeing the same post three times counts as one reach but three impressions.
Formula. Reach is a direct platform metric — you don't calculate it, you read it. The derivative metric agencies report is reach rate: reach divided by followers, expressed as a percentage.
Reach rate = (Reach per post / Followers) × 100
2026 benchmark. Per Socialinsider's 2025 social media reach data, the average Instagram reach rate is ~3.5% of followers. Healthy ranges by account size: under 10K followers: 8–15%; 10K–100K: 5–10%; 100K+: 3–7%. Socialinsider does not publish comparable reach-rate numbers for Facebook, X, or LinkedIn — so only cite the Instagram figure in reports.
Platform nuances.
- Instagram: Reach is now the headline Instagram metric since the platform deprioritized "impressions" in 2024. Reels reach typically exceeds feed reach for brands.
- Facebook: Organic reach is commonly reported as 1–5% of Page followers. Reach is tracked separately for paid vs. organic.
- TikTok: Reach is less emphasized than Views; the For You Page distribution means reach can exceed follower count by 10–100x on a viral post.
- LinkedIn: Reach surfaces as "Impressions" in Page Analytics; true unique reach isn't displayed directly for organic content.
- X: Reach is labeled "Organic Impressions"; X does not distinguish reach from impressions cleanly in the default dashboard.
How to present to clients. Reach tells the client how many real people saw your work. Frame it in context: "This month, 127K unique people on Instagram saw your content — that's roughly 4% of Chicago's target demographic you're trying to reach." Tying reach to a real-world population makes it feel earned rather than random.
Common mistake. Reporting "total impressions" as if it were reach. Impressions count total displays; one reached user can generate multiple impressions. Agencies that don't distinguish look either sloppy or deliberately inflating.
Improvement tactics.
- Instagram: Prioritize Reels and shareable carousels — both have higher organic reach than single feed images.
- TikTok: Post when your audience is active (use TikTok Analytics follower activity data) and lean into trending audio within 48 hours of the trend starting.
- LinkedIn: Document posts (PDF carousels) consistently outperform text-only posts on reach.
For the full definition and the reach-vs-impressions diagnostic framework, see our guide on views vs. impressions.
2. Impressions
Definition. Impressions count the total number of times content was displayed — including repeat displays to the same user. If 500 people each saw your post twice, reach is 500 and impressions are 1,000.
Formula. Impressions are a direct platform metric. The reporting derivative is the impression-to-reach ratio, which signals content resonance and re-display frequency.
Impression-to-reach ratio = Impressions / Reach
A ratio between 1.2 and 2.5 is typical. Above 2.5 usually means the platform is showing the post multiple times to the same users (strong performance). Below 1.2 can mean the post is being scrolled past quickly.
2026 benchmark. No single "impressions-per-post" benchmark exists. Socialinsider's 2026 Instagram benchmarks, based on 35 million posts across 447,613 pages, report views per post by account size: 1–5K followers average 417–993 views per post; 100K–1M followers average 16,035–35,370 views per post, with carousels leading.
Platform nuances.
- Instagram: Now reports "Views" as the primary top-of-funnel metric; "Impressions" remains visible in ad reporting.
- Facebook: Distinguishes "served" impressions (delivered) from "viewed" impressions (on-screen) — use viewed for reporting.
- TikTok: Counts views instantly on autoplay; no minimum watch-time threshold before counting.
- LinkedIn: Counts an impression when 50% of the post is visible for 300ms minimum.
- X: Counts "post seen" whenever the post enters the viewport.
How to present to clients. Impressions alone can mislead. Always pair with reach (are we reaching new people?) and engagement rate (are they acting?). The best client framing: "Your content was displayed 240K times this month to a unique audience of 127K — a 1.9x ratio, which means the algorithm is re-serving your content to engaged users."
Common mistake. Celebrating rising impressions without corresponding engagement growth. Rising impressions plus flat engagement usually signals the algorithm found a low-quality audience — not a win.
Improvement tactics. Focus on reach first; impressions generally follow. Carousels and Reels on Instagram tend to compound impressions as the algorithm re-shows them to engaged users.
For the full platform-by-platform breakdown of impression definitions and how to diagnose high-impression-low-engagement scenarios, see our guides on social media impressions and what are impressions on Instagram.
3. Follower Growth Rate
Definition. The percentage increase in follower count over a defined period (daily, weekly, monthly, quarterly). A pure count ("+500 followers") means nothing without context — a 500-follower gain on a 1,000-follower account is huge; on a 1M-follower account, it's invisible.
Formula.
Follower growth rate = ((New followers − old followers) / old followers) × 100
2026 benchmark. Hootsuite's 2026 social media benchmarks report weekly follower growth rates: TikTok 197.37% (heavily skewed by low-base accounts), Facebook 14.53%, Instagram 1.37%, LinkedIn 0.85%, X 0.00%. Socialinsider reports annual Instagram growth averaging 22% for 1–5K accounts and 11.25% for 100K–1M accounts.
Platform nuances.
- TikTok: The 197% headline figure is misleading — it reflects new accounts adding a handful of followers off tiny bases. For established brands, 5–20% monthly is closer to realistic.
- Instagram: Sub-2% monthly is typical for established accounts. Growth above 5%/month for a 10K+ account usually signals viral content or paid acquisition.
- LinkedIn: The slowest-growing major platform on average. Steady 0.5–2%/month is healthy for B2B brands.
- Facebook: Declining for most organic brand pages. Focus on group growth instead of Page growth.
How to present to clients. Pair growth rate with a follower quality check. Growing by 8% in a month isn't valuable if the new followers are bots or outside the client's ICP. Always frame: "Followers grew 4.2% this month — of those new followers, 73% match the client's ICP demographic (US-based, age 25–44, parent of school-age child)."
Common mistake. Celebrating follower spikes from viral posts without checking whether the new followers stick. Post-viral churn of 20–40% is common within 30 days.
Improvement tactics.
- Instagram: Collaboration posts and Reels with shareable hooks drive the highest follower acquisition.
- LinkedIn: Creator Mode + consistent document posts (carousel PDFs) drive sustained growth.
- TikTok: Niche-first content outperforms broad-trend content for follower-quality growth.
4. Share of Voice (SoV)
Definition. The percentage of all conversations or mentions in a category that belong to your brand, vs. competitors. SoV is explicitly competitor-relative — it requires defining your competitive set.
Formula.
Share of Voice = (Your mentions / Total category mentions) × 100
Mentions can include direct brand mentions, hashtag use, product references, or sentiment-weighted mentions depending on the tool.
2026 benchmark. There is no universal SoV benchmark — it's always relative to the competitor set you define. Per Sprinklr's share-of-voice guide, leading SaaS brands typically hold ≥25% SoV within their subcategory. The most-cited prescriptive framework is Les Binet and Peter Field's IPA research, which correlates Excess Share of Voice (eSOV) with market share growth — roughly 0.5 percentage points of annual market share growth per 10 eSOV points. Brandwatch's SoV guide covers the measurement frameworks in detail.
Platform nuances.
- X: Easiest platform to measure SoV because mentions are public and fully searchable.
- Instagram: SoV is usually hashtag-based; tool support varies.
- LinkedIn: SoV is typically measured in industry-relevant hashtags or comment threads on competitor content.
- TikTok: Hashtag-based SoV with heavy tool dependency (native API access is limited).
How to present to clients. Frame SoV as competitive position, not volume. "This quarter, your brand accounted for 18% of industry conversation — up from 12% last quarter. The three main competitors sit at 24%, 21%, and 15%. You're now in third place in the category, up from fifth."
Common mistake. Reporting raw mention counts as "SoV" without defining the competitor set. Mentions can double because the whole category grew — that's not a win for the brand.
Improvement tactics. SoV grows through consistent category commentary, not just brand promotion. Comment on competitor posts, engage in industry hashtags, and publish perspective-led content rather than announcements. Tools like Brandwatch, Talkwalker, and Rival IQ handle the measurement layer.
5. Engagement Rate (by Followers)
Definition. The headline engagement metric. Engagement rate measures how actively your audience responds to content — likes, comments, shares, saves, reactions, clicks — as a percentage of followers (or reach, depending on formula).
Formula. Two common variants:
ER by followers = (Total engagements / Followers) × 100
ER by reach    = (Total engagements / Reach) × 100
The "by reach" formula is the one most agencies should report because it normalizes for algorithm-driven distribution variance. The "by followers" formula is easier to pull and is what most published benchmarks use.
2026 benchmark. Per Socialinsider's 2026 Social Media Benchmarks (dataset: 70M posts, 2025), engagement rate by followers: TikTok 3.70%, Instagram 0.48%, Facebook 0.15%, X 0.12%. Per the Rival IQ 2025 Social Media Industry Benchmark Report (4M posts, 9B interactions, 2,100 brands, 14 industries), all-industry median engagement rate was 0.36% across platforms, with year-over-year declines of Facebook −36%, Instagram −16%, TikTok −34%, X −48%.
Platform nuances.
- Instagram: Carousels average 0.55% ER (Socialinsider), outperforming static (0.37%) and Reels (0.52%).
- TikTok: Highest platform ER at 3.70%; declining YoY but still 8–10x higher than Meta platforms.
- LinkedIn: Higher ER than most people expect — document posts regularly exceed 3–5% on B2B accounts.
- Facebook: The lowest ER among major platforms. Organic reach collapse over the last 5 years is the root cause.
- X: Declining fastest of the major platforms (−48% YoY). Reply and repost rates remain the most useful sub-metrics.
How to present to clients. Always disclose the formula used, and pair with platform-specific benchmarks. "Your TikTok engagement rate is 4.2% — above the platform average of 3.7% (Socialinsider 2026). On Instagram, you're at 0.61% — above the 0.48% platform average. Both platforms are performing above benchmark."
Common mistake. Using "by followers" ER across all platforms without noting that Instagram and TikTok often display better with "by reach" or "by views" instead. The inconsistency makes reports look amateur.
Improvement tactics.
- Instagram: Shift static posts to carousels. Socialinsider's 2026 data shows carousels drive the highest ER on Instagram.
- LinkedIn: Document posts (PDF carousels) consistently outperform single images and text-only posts.
- TikTok: Comment-bait hooks and "wait for it" formats dominate ER leaderboards.
For full platform-by-platform formulas and improvement playbooks, see our engagement rate calculator guide and client engagement metrics.
6. Conversation Rate
Definition. From Avinash Kaushik's original social media framework (2011). Conversation rate measures how much audience discussion a piece of content generates — specifically comments, not likes or shares.
Formula.
Conversation rate = (Comments per post / Followers) × 100
2026 benchmark. No widely published industry average. Socialinsider reports raw comments-per-post tiered by account size on Instagram: 1–5K followers receive 1–3 comments per post; 100K–1M receive 38–60 comments per post (format-dependent). Report conversation rate as a trend against the client's own 90-day baseline, not against an industry number.
Platform nuances.
- LinkedIn: The highest conversation-rate platform for B2B content. Post-with-question + industry-specific hashtags regularly drives 30+ comments on 10K-follower accounts.
- Instagram: Comments concentrate on Reels and carousels; static images lag.
- TikTok: High comment volume but short comments; often single-word reactions.
- X: Reply-heavy; each reply is a separate mini-thread rather than attached to the original post.
How to present to clients. Frame as qualitative signal. "Your posts received 42% more comments per post this month vs. baseline — and of those comments, 68% were substantive (3+ words, ICP-matched commenters). That's a community-health signal, not just a vanity signal."
Common mistake. Counting all comments equally. A "🔥🔥🔥" comment and a three-paragraph question should not weigh the same in reports. Some tools support comment-sentiment weighting — use it.
Improvement tactics. Comment-bait hooks ("what would you add?"), polarizing but respectful takes, and industry-specific questions drive the highest conversation rates. Replying to the first 10 comments within 60 minutes amplifies conversation further by signaling to the algorithm that the post is active.
7. Amplification Rate
Definition. Also from the Kaushik framework. Amplification rate measures how much your audience spreads your content — shares, reposts, retweets — relative to your follower base.
Formula.
Amplification rate = (Shares per post / Followers) × 100
2026 benchmark. Same Kaushik origin as conversation rate; no published industry benchmark exists. Treat as a trend against your own 90-day baseline. Rising amplification rate is one of the strongest organic-growth signals because each share introduces the content to a new follower network.
Platform nuances.
- LinkedIn: Reposts (especially with commentary) are the primary amplification signal. Document posts amplify heaviest.
- Instagram: Reels and carousels amplify via shares to Stories and DMs.
- X: Reposts and quote-posts are the amplification signal. Quote-posts count higher because they add context.
- TikTok: Shares to external platforms (DMs, Stories) are the amplification signal; duets and stitches are separate metrics.
- Facebook: Amplification via shares has collapsed alongside organic reach.
How to present to clients. Emphasize that amplification is a leading indicator for follower growth. "Your amplification rate rose 30% this month — each of your top 3 posts was reshared to an average of 280 external audiences. Expect follower growth to follow in weeks 4–8."
Common mistake. Reporting raw share counts without rate normalization. 100 shares on a 1,000-follower account is elite; 100 shares on a 100K account is weak.
Improvement tactics. Shareable formats win: LinkedIn document posts, Instagram carousels with save-or-share hooks, TikTok videos with external relevance (advice, how-to, counterintuitive takes).
8. Save Rate
Definition. Specific to Instagram. Save rate measures how often users save a post for later reference — a much stronger intent signal than a like because it means the content has practical value worth returning to.
Formula.
Save rate = (Saves per post / Reach) × 100
2026 benchmark. Socialinsider's 2026 Instagram benchmarks report raw saves per post tiered by account size: 1–5K followers average 1 save/post; 100K–1M follower accounts average 43–98 saves/post, with carousels leading. No widely published "save rate as % of reach" headline benchmark exists. Report against your own 90-day baseline.
Platform nuances.
- Instagram: The only major platform with a native "save" action. Carousels and Reels drive higher save rates than static posts.
- TikTok: Has a "favorites" equivalent, less emphasized in reporting.
- LinkedIn/Facebook/X: No direct equivalent — bookmark is closer but reported separately.
How to present to clients. Frame saves as "intent to use later." "Your top-performing carousel this month was saved 340 times — that's 340 people who saw content valuable enough to bookmark for reference. Saves are one of the strongest predictors of long-term follower loyalty."
Common mistake. Ignoring saves in favor of likes. Likes are a passing signal; saves mean the content is worth returning to. Agencies that optimize for saves over likes usually see better compound engagement over 6–12 month windows.
Improvement tactics.
- Design carousels as "reference" content (step-by-step guides, frameworks, decision trees).
- End Reels with "save this for later" CTAs.
- Use text-overlay headlines that highlight practical value ("5 ways to X").
9. Video Completion Rate
Definition. The percentage of viewers who watched a video through to the end. On short-form platforms (Reels, TikTok, Shorts), completion rate is one of the most powerful algorithmic signals — it directly drives distribution.
Formula.
Video completion rate = (Completed views / Total views) × 100
"Completed view" definition varies per platform — see nuances below.
2026 benchmark. Per aggregator reports (Shortimize length-vs-completion analysis and AutoFaceless short-form video statistics), average completion rates sit around TikTok ~78%, YouTube Shorts ~73%, Instagram Reels ~65%. For Reels under 30 seconds, 40–50% completion is "good" and >55% is excellent. These figures come from secondary aggregators rather than primary vendor reports — cite with soft language ("aggregator estimates") or benchmark against the client's own baseline.
Platform nuances.
- TikTok: Tracks full watch-through; 100% completion or higher (re-watches) is the strongest algorithmic signal.
- Instagram Reels: Tracks completion + average watch-time; both feed the algorithm.
- YouTube Shorts: Tracks average view duration more than binary completion.
- LinkedIn Video: 2-second minimum view with 50% on-screen; completion data is less granular.
- Facebook Video: 3-second minimum view count; watch-time is the real signal.
How to present to clients. Report completion rate alongside watch-time in seconds. "Your Reels averaged 62% completion this month — above the 55% 'excellent' threshold for sub-30-second Reels. Average watch time was 14.2 seconds, meaning nearly every viewer watched your full hook-and-payoff structure."
Common mistake. Reporting video views without completion rate. A video with 50K views and 8% completion is a hollow win — the algorithm will deprioritize future videos from the account.
Improvement tactics.
- First 3 seconds: Strong hook is non-negotiable. Text overlay + motion + implied payoff.
- Video length: Sub-15-second videos tend to complete at 70%+; sub-30-second at 55%+; longer videos require deliberate narrative arcs.
- Pattern-interrupts every 3–5 seconds: Angle changes, cuts, text shifts.
- Loop-back endings: TikTok especially rewards videos that loop seamlessly because viewers re-watch.
10. Click-Through Rate (CTR)
Definition. The percentage of impressions or views that resulted in a click on a link — to the website, bio link, Story link, or promoted content.
Formula.
CTR = (Clicks / Impressions) × 100
2026 benchmark. Credible organic CTR benchmarks are sparse publicly because platforms restrict organic click-data reporting. Helen Thompson Media's 2025 Social Media CTR Benchmarks cites LinkedIn organic CTR around 0.22%. Paid CTR benchmarks are more published (Meta ads ~0.90%, LinkedIn ads ~0.65%) but paid ≠ organic. For organic, report against your own 90-day baseline and use paid CTR only where the client is running paid campaigns.
Platform nuances.
- LinkedIn: The highest-CTR organic platform for B2B; document posts regularly drive 0.5–1.5% CTR.
- Instagram: No clickable links in captions; CTR reported from bio-link clicks and Story-link taps.
- TikTok: Bio-link CTR only; Story-equivalent link stickers vary.
- X: Organic link CTR has collapsed post-2023 as the algorithm deprioritized external links.
- Facebook: Link posts receive lower organic distribution than native content; CTR looks good in isolation but reach is constrained.
How to present to clients. Pair CTR with the landing-page destination performance. "Your 1.3% CTR this month drove 2,840 site visits — 94 of which converted to lead form submissions, for a 3.3% landing-page conversion rate. That's 94 qualified leads from organic social alone."
Common mistake. Reporting CTR without reporting what happened after the click. A 3% CTR that delivers bouncing traffic is worse than a 1% CTR that converts.
Improvement tactics.
- Use specific, benefit-led CTAs rather than generic "learn more."
- Test bio-link tools (Link-in-Bio, Start Page, LNK.Bio) for Instagram and TikTok — PostPlanify's link-in-bio provides per-click analytics.
- On LinkedIn, document posts drive CTR when the CTA appears on the last slide of the PDF.
11. Social-Driven Website Sessions
Definition. The volume (and percentage) of website traffic originating from social media channels. Reported in Google Analytics 4 (GA4), site analytics platforms, or tools with GA integrations.
Formula.
Social share of traffic = (Sessions from social / Total sessions) × 100
Plus assisted conversions — traffic that touched social before converting through another channel.
2026 benchmark. Per Similarweb's 2025 website traffic benchmarks, social media averages ~7% of total website traffic across industries. Large enterprises (Similarweb's "Giants") average closer to 1%. Of social referrals, Facebook drives 76.56% of total social traffic (making it roughly 7.75% of total site traffic for the average site). Massive industry variance — ecommerce and DTC brands often see 15–30% from social; B2B SaaS sees 2–5%.
Platform nuances.
- Facebook: Still the top referrer for most brands despite organic reach issues.
- LinkedIn: Drives the highest-intent social traffic for B2B; conversion rate is typically 2–3x other platforms.
- Instagram: Bio-link traffic only; Story links for accounts with 10K+ followers.
- TikTok: Bio-link traffic; volume lower than IG/FB but intent often higher among engaged viewers.
How to present to clients. Pair with assisted conversions. "Social drove 8,420 sessions this month — 11% of your total site traffic. 340 of those sessions converted directly; another 180 converted in later sessions after first touching social. Total attributed conversions: 520. Last-click reporting only shows 340, which undersells social's actual impact."
Common mistake. Relying only on last-click attribution. Social is often a discovery and consideration channel; last-click credits whichever channel closed the deal (often search or direct).
Improvement tactics.
- Tag every link with UTM parameters so GA4 attribution is clean.
- Run assisted-conversion reports monthly, not just direct-conversion.
- For ecommerce, connect platform-native conversion tracking (Meta Pixel, TikTok Pixel) alongside GA4.
12. Lead Conversion Rate
Definition. The percentage of visitors from social media who complete a desired action (lead form submission, demo booking, email signup, purchase) on a landing page.
Formula.
Lead conversion rate = (Conversions from social / Landing page visits from social) × 100
2026 benchmark. Per Unbounce's Conversion Benchmark Report (41,000+ landing pages, 464M visits), social traffic converts at 1.5% on average on landing pages — the lowest-intent paid channel in their dataset. The all-industry median landing-page conversion rate is 6.6%, with SaaS at 3.8%, Financial Services at 8.4%, and Events & Entertainment at 12.3%. The 1.5% figure is the most defensible benchmark for social-sourced lead conversion.
Platform nuances.
- LinkedIn: Highest-intent social traffic for B2B; conversion rates often 3–5% on landing pages matched to the audience.
- Facebook/Instagram: 1–2% landing-page conversion is typical for cold paid traffic; organic social often converts 2–3x higher on audiences who already know the brand.
- TikTok: Lower landing-page conversion than other platforms historically; improving as TikTok audiences mature.
- X: Limited clickable surface area; conversion rate depends heavily on offer relevance.
How to present to clients. Benchmark against the social-source conversion standard, not the all-channel one. "Your social-sourced landing pages converted at 2.4% — above Unbounce's 1.5% social benchmark. Better still, LinkedIn traffic converted at 4.1%, suggesting the content-audience fit there is especially strong."
Common mistake. Comparing social-driven conversion rates against email or SEO benchmarks (which are much higher). Social is a discovery channel; apples-to-oranges comparisons make good work look bad.
Improvement tactics.
- Match landing page copy and visuals to the post the visitor came from (creative congruence raises conversion by 20–40%).
- Build per-platform landing pages rather than one catch-all page.
- Test single-offer pages (high-conversion) against information-heavy pages (lower-conversion but often higher-quality leads).
13. Social Media ROI / ROAS
Definition. Two distinct metrics often confused. ROI (return on investment) is the profit generated per dollar spent on all social activity (organic + paid + tools + labor). ROAS (return on ad spend) is specifically about paid media — revenue per dollar of paid ad spend.
Formulas.
ROI  = ((Revenue generated − total investment) / total investment) × 100
ROAS = Revenue from ads / ad spend
2026 benchmark. Per Focus Digital's 2025 Facebook Ads ROAS report and Triple Whale's Facebook ad benchmarks, the all-industry Facebook Ads average ROAS is 2.19x, with "healthy" ecommerce ROAS sitting at 3x–5x. Industry breakdown: Automotive 2.54x, Sports & Outdoors 2.28x, Travel 2.25x top; Media & Publishing 1.17x lowest. Per Sprout Social's 2025 Index, only 23% of social marketers use social data to measure ROI and only 44% of marketing leaders rate their social team at "expert" level for measuring business impact.
Platform nuances.
- Facebook Ads: The most mature ROAS reporting; Meta Pixel handles attribution cleanly.
- Instagram Ads: Often reported alongside Facebook; shared ad infrastructure.
- TikTok Ads: Growing, but attribution tools are less mature; ROAS benchmarks vary widely.
- LinkedIn Ads: Higher cost-per-click but higher lead quality; ROAS framing works less well than CPA (cost per acquisition) for B2B.
How to present to clients. Always separate paid ROAS from full social ROI. "Your paid social ROAS was 3.4x this quarter — above the 2.19x Facebook average. Blended social ROI (organic + paid + tools + labor) was 1.6x, which means every dollar invested in social generated $1.60 in attributed revenue. On a 12-month horizon, this trajectory compounds because organic audience growth reduces paid-acquisition costs."
Common mistake. Reporting ROAS as if it equals ROI. ROAS ignores organic investment and tool costs. An agency reporting 4x ROAS while running at a 1.2x blended ROI is masking cost bloat.
Improvement tactics. For the full math and real scenarios:
- ROI on social media: what actually counts — ecommerce and B2B worked examples.
- How to measure social media ROI — foundational measurement framework.
14. Response Time
Definition. The average time it takes to reply to comments, DMs, mentions, and support inquiries on social. One of the most underreported KPIs, even though it's one of the most consequential for brand perception and customer retention.
Formula.
Average response time = Sum of (reply time − inquiry time) / total inquiries
Best reported in medians as well as averages (averages skew toward outliers).
2026 benchmark. Per the 2025 Sprout Social Index (survey: 4,044 consumers, 900 practitioners, 322 marketing leaders): 73% of consumers expect a response within 24 hours or sooner. 42% expect a response within 60 minutes. 73% will choose a competitor if their social inquiries go unanswered. 75% are comfortable with brands using AI/automation to deliver faster response times. This is the single most citable, most consistent benchmark in the entire KPI list — it shows up in Sprout's Index every year from 2022 onward.
Platform nuances.
- Instagram DMs: The highest-volume inbound support channel for consumer brands. Most brands target sub-2-hour response.
- Facebook Messenger: Public "very responsive to messages" badge appears for pages with <15-min response time and >90% response rate over 7 days.
- LinkedIn: DMs skew professional/partnership; 24-hour response usually acceptable.
- X: The fastest-response platform expectation; 60-minute target for high-traffic brand accounts.
- TikTok: Comment volume is the primary inbound channel; DMs are less used.
How to present to clients. Frame response time against the 24-hour / 60-minute dual benchmark. "This month, your average first-response time across Instagram, Facebook, and LinkedIn was 38 minutes — well within the 60-minute benchmark that 42% of consumers expect. Median response was 22 minutes. Zero messages went unanswered, meaning you didn't lose any of the 73% of consumers who would choose a competitor after silence."
Common mistake. Reporting "total responses sent" without reporting response time. 500 replies sent over a week doesn't mean anything if the average response took 11 hours.
Improvement tactics.
- Use a unified social inbox rather than switching between native apps. PostPlanify's social inbox consolidates Instagram, Facebook, and LinkedIn messages and comments into one queue with team assignment and response-time tracking.
- Define SLA tiers: urgent (1 hour), standard (8 hours), non-urgent (24 hours).
- Set up auto-reply / "we're looking into it" holding messages for off-hours inquiries to start the response clock early.
15. Audience Quality
Definition. A qualitative score combining demographic match to the client's Ideal Customer Profile (ICP), bot/inauthentic-follower share, and engaged-follower share. Not a single number — a composite view.
Formula. No universal formula. Typical composition:
Audience quality score = weighted combination of:
  - % of followers matching ICP demographic (age, location, role, industry)
  - % of bot/inauthentic followers (estimated)
  - % of engaged followers (likes/comments in last 90 days)
2026 benchmark. No public industry benchmark. InfluencerDB's framework suggests influencer audiences scoring below B− are ROI risks. For brand accounts, most agencies target: 60%+ ICP demographic match, under 5% inauthentic followers, 15%+ engaged-follower share in the last 90 days. Treat as framework, not benchmark.
Platform nuances.
- Instagram: Audience demographics in Account Insights (age, gender, location, top cities).
- LinkedIn: Richest B2B audience data (industry, company size, seniority).
- TikTok: Demographics via TikTok Analytics (age, gender, top territories, follower activity by hour).
- Facebook: Page Insights provides demographic breakdowns; declining data quality as users reduce profile completeness.
- X: Limited first-party demographic data; heavy reliance on third-party audience tools.
How to present to clients. Frame as "quality adjustment" to follower count. "You have 24K followers, but 72% match your ICP demographic. Your 'working audience' is closer to 17K — still ahead of where we started (14K working audience at onboarding baseline). Raw follower count is up 4%; working audience is up 12%."
Common mistake. Ignoring audience quality entirely and reporting raw follower growth. A client whose account grew by 3,000 followers but whose ICP-match percentage dropped from 68% to 52% has actually gone backwards on audience quality.
Improvement tactics.
- Audit follower quality quarterly — flag rapid follower inflows without corresponding engagement growth.
- Platform demographic filters + account deactivation (block obvious bot accounts) improve long-term engagement rate.
- Content that speaks specifically to ICP drives higher ICP-match follower acquisition than broad-appeal content.
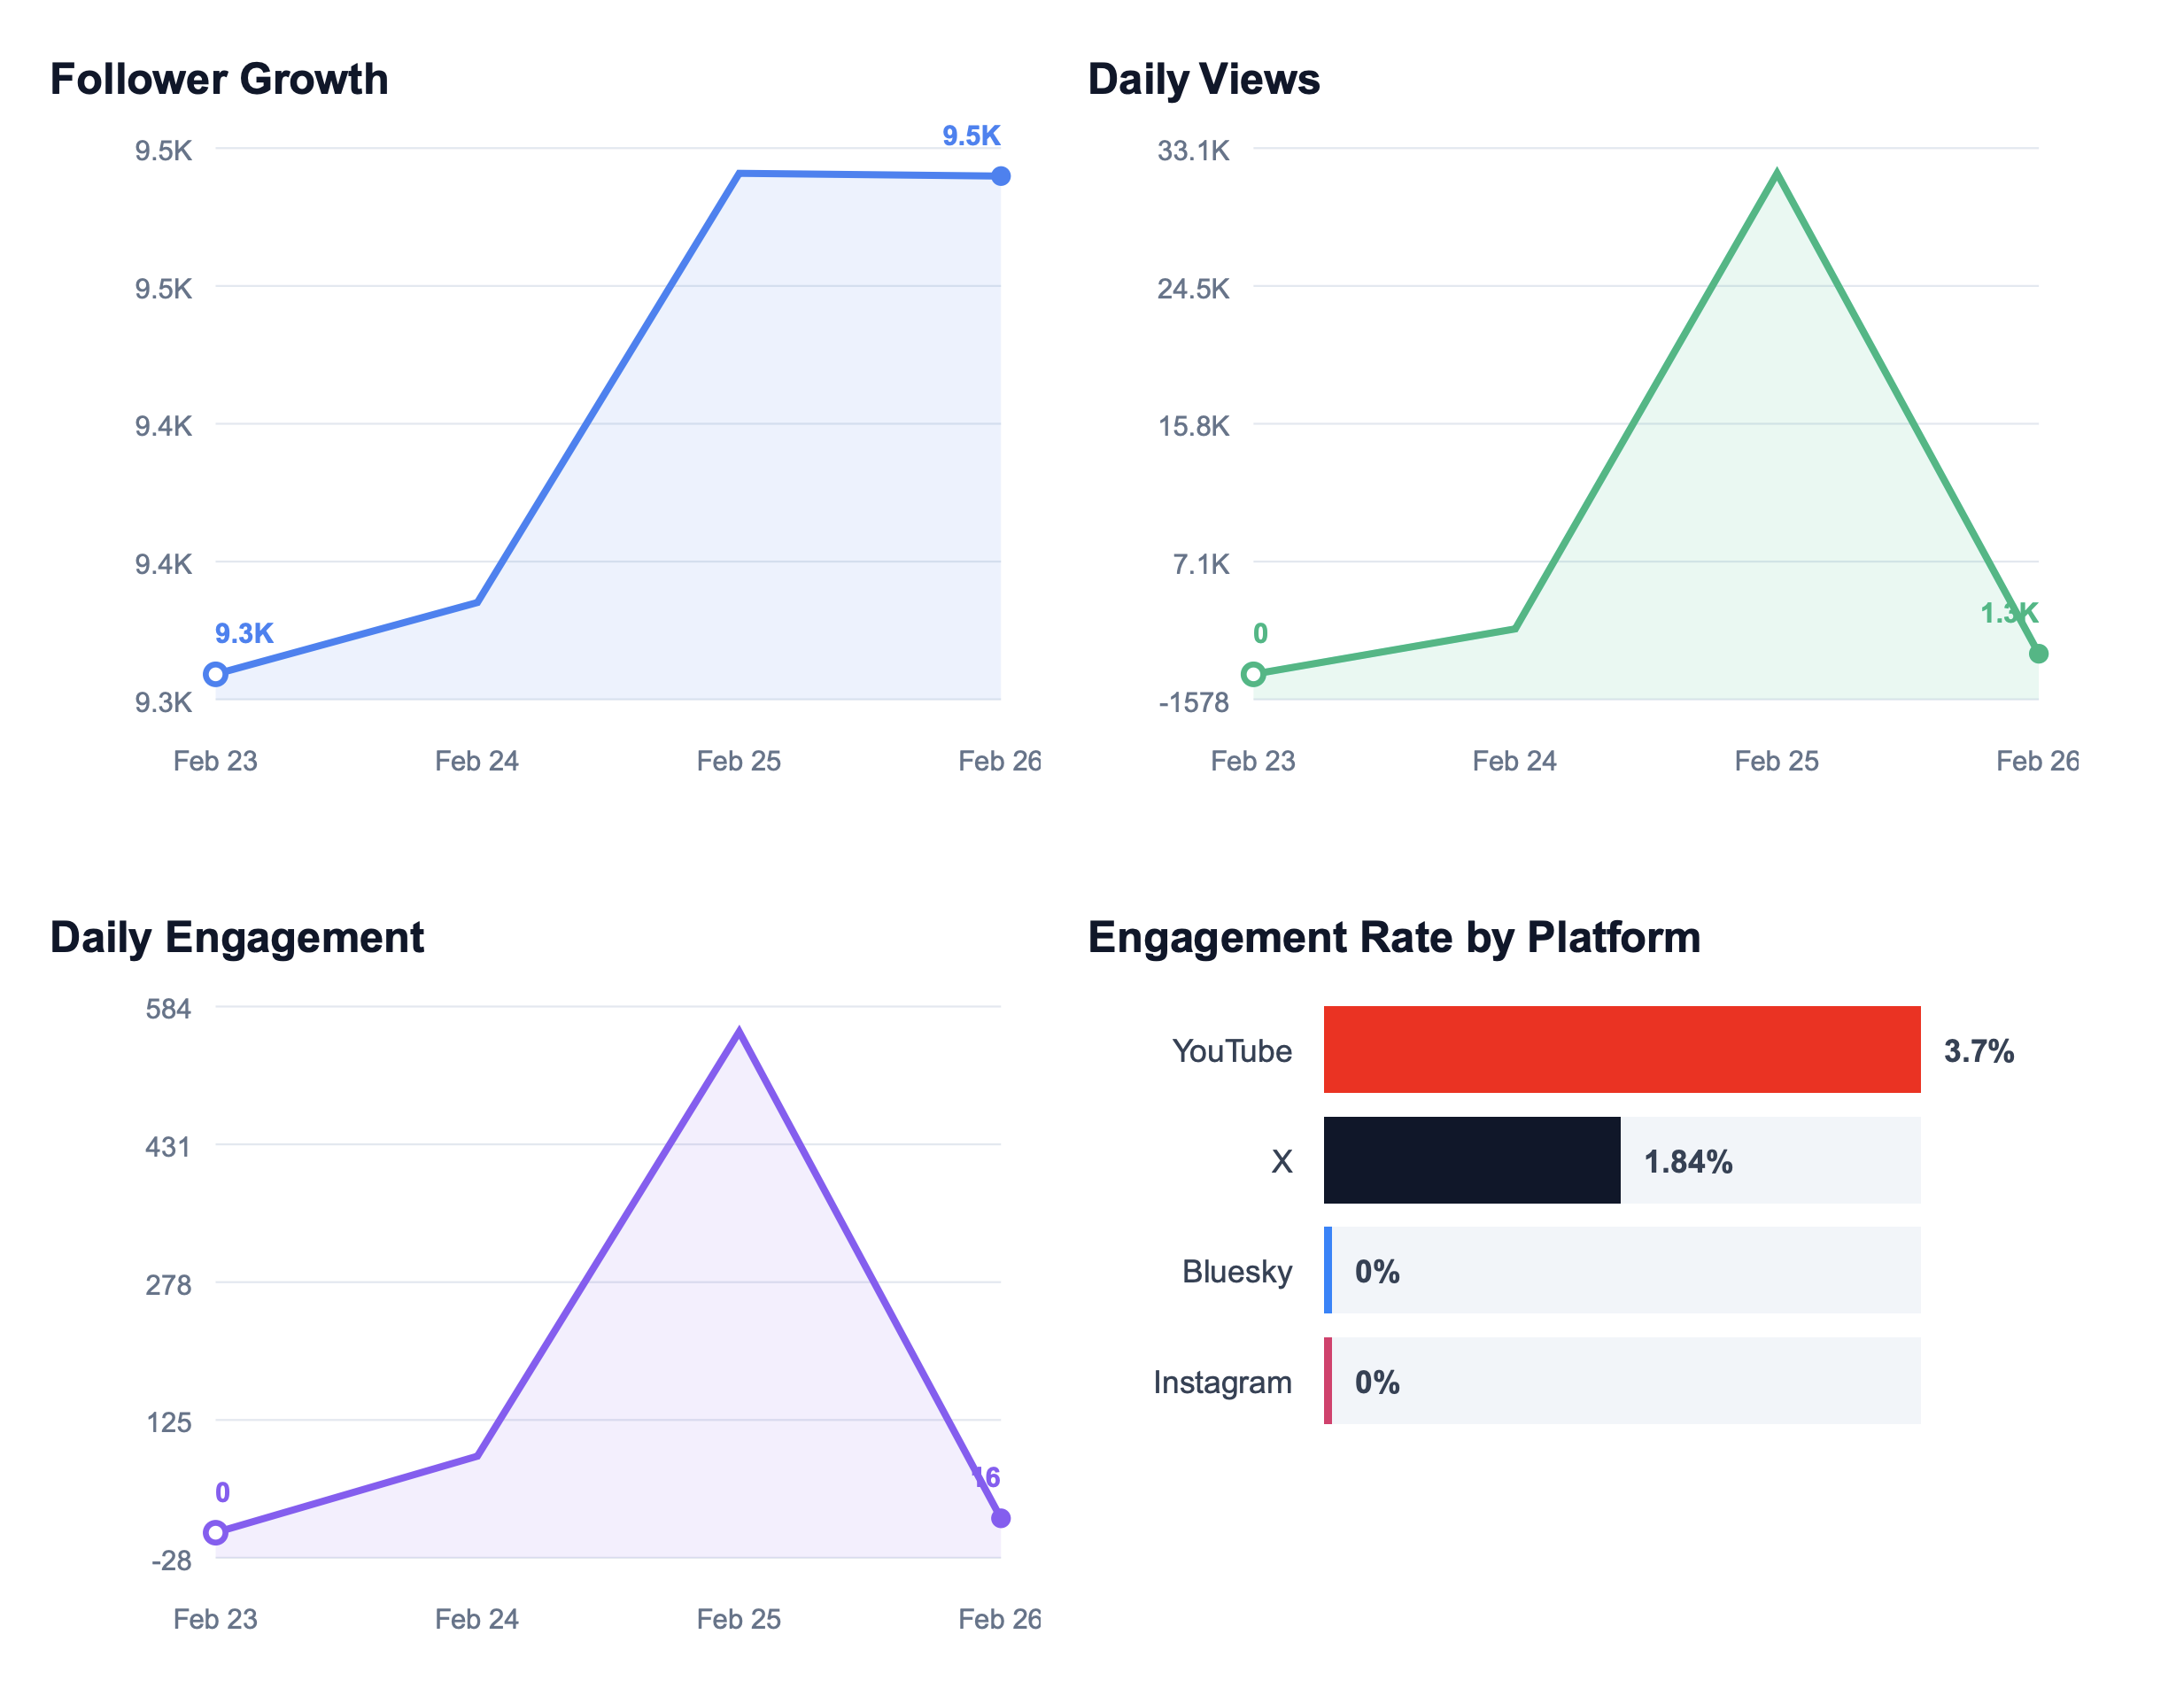
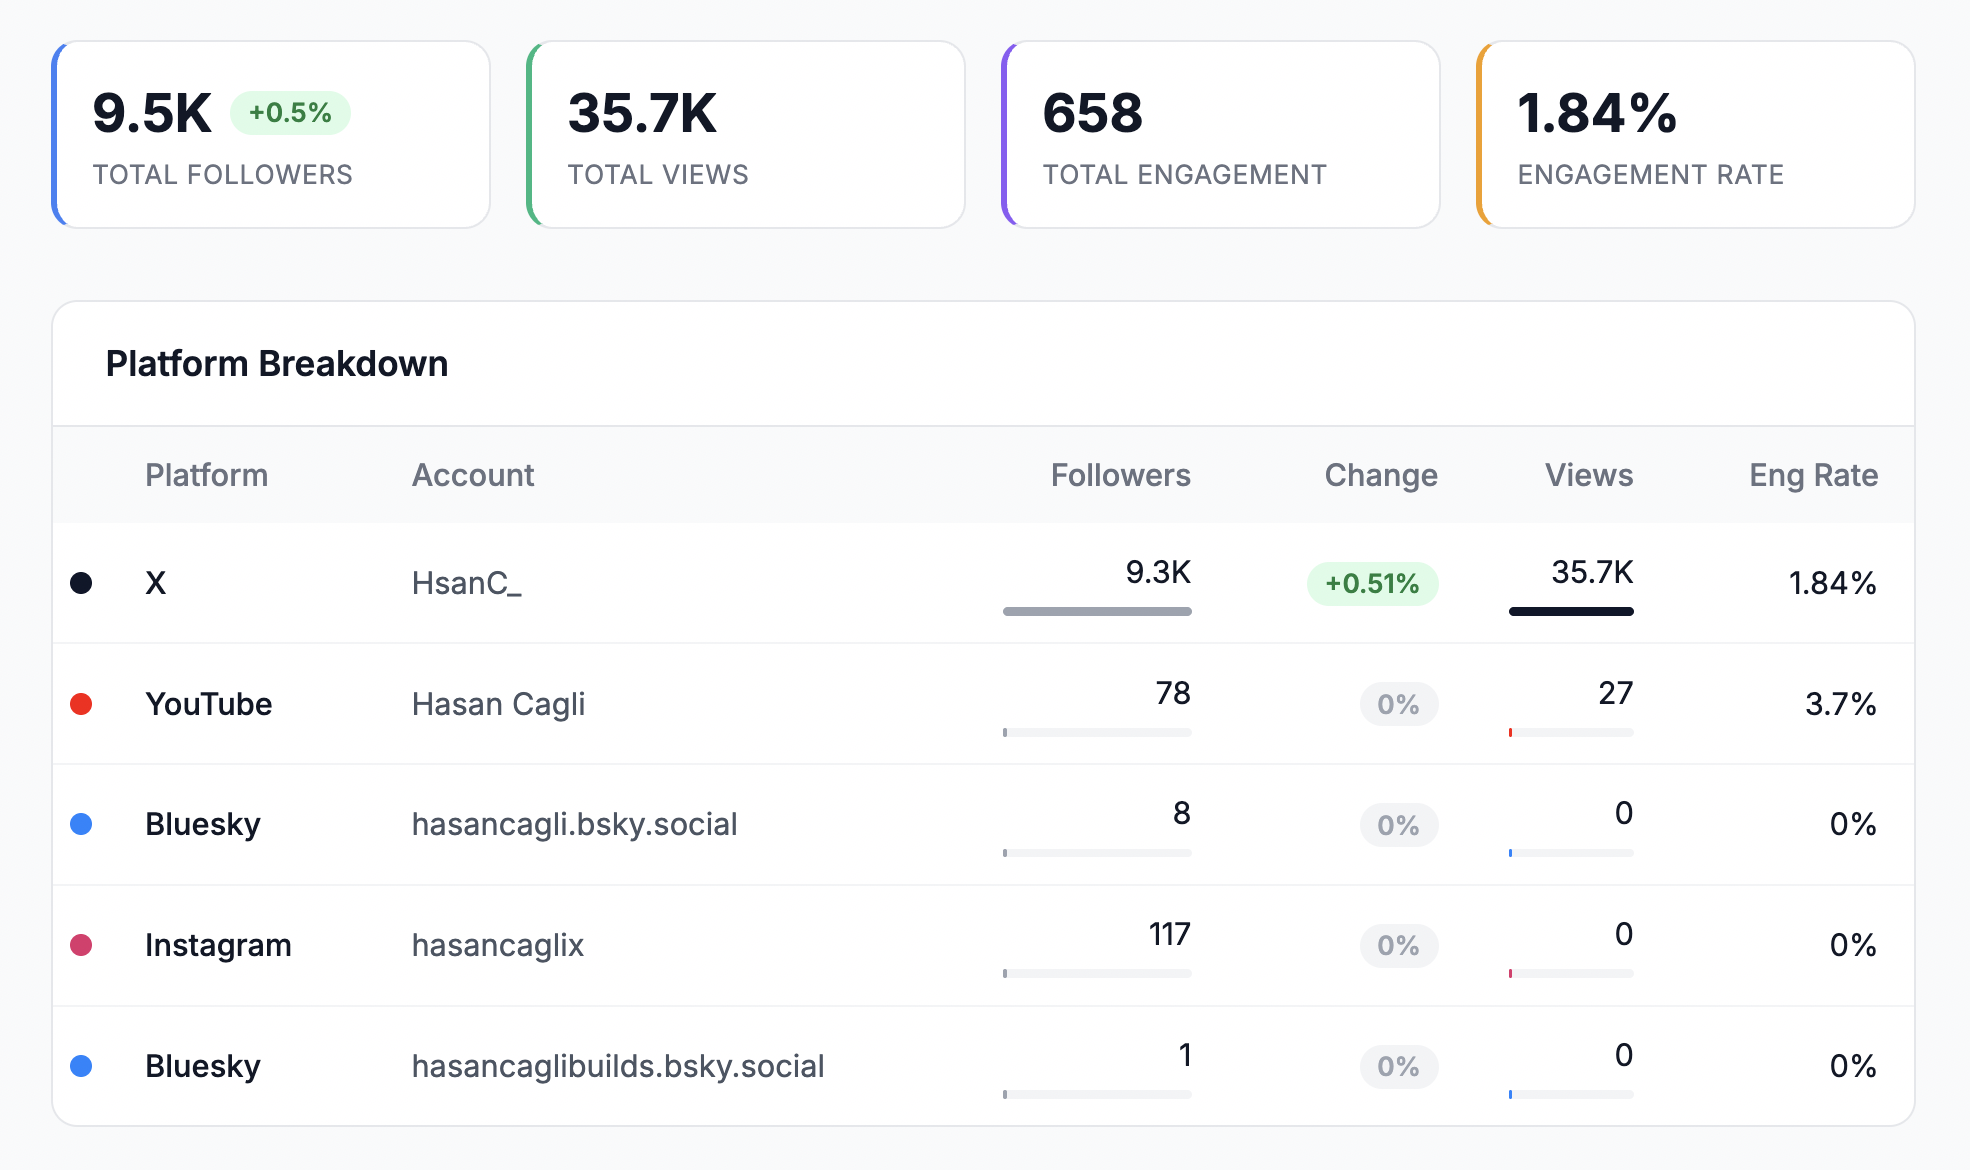
All your social media in one simple dashboard
Schedule posts, track analytics, and reply to comments/DMs — without switching tabs.

Engagement
+18%
Views
52.8k
Which KPIs Matter Most by Client Objective
Not every engagement needs all 15 KPIs in the monthly report. Match the KPI set to the client's primary business objective:
| Client Objective | Primary KPI | Supporting KPIs |
|---|---|---|
| Lead generation (B2B) | Lead Conversion Rate | CTR, Social-Driven Sessions, Engagement Rate, Follower Growth Rate |
| Direct sales (ecommerce) | ROAS / ROI | CTR, Lead Conversion Rate, Engagement Rate, Reach |
| Brand awareness | Share of Voice | Reach, Follower Growth Rate, Amplification Rate |
| Community building | Engagement Rate | Conversation Rate, Response Time, Save Rate |
| Thought leadership (B2B) | Amplification Rate | Engagement Rate, Reach, LinkedIn Follower Growth |
| Customer retention / care | Response Time | Conversation Rate, Sentiment (if tracked) |
| Content performance (creator brands) | Video Completion Rate | Save Rate, Engagement Rate, Follower Growth Rate |
| Franchise / multi-location | Reach per location | Engagement Rate per location, Response Time per location |
For agencies managing multiple clients with different objectives in parallel, isolating KPI dashboards per client is the practical requirement. Tools built around dedicated client workspaces (like PostPlanify, which offers 5–50 workspaces depending on tier) let each client have its own KPI dashboard without cross-contamination. For the full agency-tool comparison on this, see our best social media tools for managing multiple brands guide.
Sample Monthly Client Report Structure
A strong monthly report covers the client's primary KPI + 4–6 supporting KPIs, answers "what happened / why / what's next," and takes fewer than 10 pages. The structure:
| Section | What Goes Here |
|---|---|
| Executive summary | 3 sentences: primary KPI vs. target, top insight, headline action for next month |
| Primary KPI scorecard | The one number the engagement is judged on + trend vs. last 3 months + benchmark comparison |
| 4 supporting KPIs | One per bucket (awareness, engagement, conversion, audience/ops), with trend and benchmark |
| Top 3 posts | Highest-performing content by primary KPI, with hypothesis on what worked |
| Bottom 3 posts | Lowest performers, with corrective lesson (not blame) |
| Audience insights | Follower growth, demographic shifts, active-time changes |
| Response time report | Average, median, and % of messages answered within SLA |
| Notable anomalies | Algorithm changes, viral moments, platform outages |
| Next month's plan | Content pillars, campaigns, and tests aligned to primary KPI |
| Questions for client | 1–2 specific asks — keeps the relationship collaborative |
White-label PDF reports with the agency's logo, accent color, and custom footer are standard for agency deliverables. PostPlanify's white-label reports ship on Premium ($159/mo billed yearly) and above, with full branding removal on Scale ($239/mo billed yearly). For a deeper report-structure walkthrough, see our guides on how to create a social media report and white-label social media reports for clients.
Common KPI Reporting Mistakes
The patterns that show up in weak agency reports — and the direct fix for each.
1. Reporting more than 7 KPIs per month. Clients can't hold more than a handful of numbers in their head during a 30-minute review. Pick 5–7 and leave the rest for quarterly deep-dives.
2. No benchmark context. A 2.1% engagement rate is meaningless without the Rival IQ or Socialinsider benchmark it sits against. Every reported number needs a comparison bar.
3. Mixing formulas across platforms. Reporting Instagram ER "by followers" and TikTok ER "by reach" in the same report makes the comparison useless. Pick one formula per KPI and disclose it.
4. Reporting vanity metrics without intent signals. Follower count, total likes, total impressions are vanity unless paired with engagement rate, save rate, or conversion rate.
5. Ignoring last-click attribution problems. Social-assisted conversions are a real agency contribution. Reports that only show direct conversions undersell the work.
6. No "why" or "what's next." A report that only answers "what happened" is a spreadsheet, not a report. Every KPI needs a one-sentence explanation of the driver and a one-sentence action.
7. No video completion rate when video is the dominant format. Brands running Reels or TikTok without reporting completion rate are missing the most algorithmically consequential metric of the month.
8. Response time never reported. Given 73% of consumers expect a 24-hour response, skipping response-time reporting leaves the client blind to a retention-risk metric.
9. Benchmarks from 2022. Platform algorithms have changed enormously. Rival IQ's 2025 report shows year-over-year engagement-rate declines of Facebook −36%, Instagram −16%, TikTok −34%, X −48%. Using 2022 benchmarks makes agency performance look worse than it is.
10. The same report structure for every client. A B2B lead-gen client and a DTC ecommerce client need different primary KPIs and different support KPIs. Same-template reporting is how agencies lose mid-tier clients who feel undifferentiated.
All your social media in one simple dashboard
Schedule posts, track analytics, and reply to comments/DMs — without switching tabs.
Engagement
+18%
Views
52.8k
FAQ: Social Media KPIs for Agencies
How many KPIs should I report to a client each month?
Five to seven, with one clearly identified as the primary KPI tied to the client's main business objective. More than seven overwhelms the 30-minute review. Fewer than five makes the report feel thin.
What's the single most important social media KPI in 2026?
Depends on the client's objective. For lead-gen B2B, it's Lead Conversion Rate. For ecommerce, it's ROAS. For community-led brands, it's Engagement Rate. For customer-care-led brands, it's Response Time. Agencies that pick a universal "most important KPI" are usually misreading the engagement.
How often should I baseline KPIs for a new client?
During onboarding, pull the last 90 days of platform data as the baseline. Revisit baselines quarterly — social benchmarks shift fast, and a KPI that was above average in Q1 can be below average by Q3. For a full onboarding-phase KPI setup, see our social media agency client onboarding checklist.
What's the difference between ROI and ROAS?
ROAS is return on paid ad spend — revenue per dollar of media buy. ROI is blended return across all social investment (organic + paid + tools + agency fees + content creation). A 4x ROAS can coexist with a 1.2x ROI when organic investment is high. Always separate them in reports.
Are vanity metrics ever worth reporting?
Raw follower count and total impressions have low signal in isolation. But follower growth rate (not count) and impression trend vs. reach (not raw impressions) are useful. The fix is to report the derivative metrics, not the raw counts.
How do I report KPIs when platform definitions don't match?
Disclose the formula in the report. Example: "Engagement Rate on Instagram uses (likes + comments + saves + shares) / followers; on LinkedIn we use (reactions + comments + reposts + clicks) / impressions per LinkedIn's native definition." Transparency beats false consistency.
Which KPIs do I need a third-party tool for?
Share of Voice requires competitive listening (Brandwatch, Talkwalker, Rival IQ). Sentiment analysis requires an analysis engine (Brandwatch, Meltwater). Audience Quality requires demographic tools and optionally bot-detection. The other 12 KPIs are accessible from platform-native analytics or unified tools like PostPlanify.
How should I report KPIs for multiple clients at once?
One dashboard per client with isolated data. Cross-client rollups should only be for internal use (e.g., agency-wide performance benchmarking), never in client deliverables. Tools with true workspace isolation enforce this automatically. For a deeper agency-tool comparison, see best social media tools for managing multiple brands.
Are engagement rate benchmarks still accurate in 2026?
Platform benchmarks have compressed heavily. Per Rival IQ's 2025 report, YoY engagement rate declines across Facebook (−36%), Instagram (−16%), TikTok (−34%), and X (−48%). Use the 2025–2026 benchmarks cited in this article, not 2022 numbers that circulate in older listicles.
What's a realistic response time SLA for a new agency?
60 minutes for consumer-facing brands, 4 hours for B2B brands during business hours, 24 hours maximum on any platform. Per the 2025 Sprout Social Index, 42% of consumers expect response within 60 minutes — a hard benchmark to beat but essential for high-stakes consumer categories.
Do I need to report Share of Voice if I'm a small agency?
If the client competes in a category with obvious rival brands, yes. Share of Voice is the most defensible way to argue for brand-awareness investment when direct conversion attribution is weak. Start with a 3-competitor set tracked via a listening tool; upgrade to full competitive dashboards when budget allows.
How do I present bad-month KPIs without losing the client?
Frame every drop as a specific cause + specific action. "Engagement rate fell 18% — driven by a platform algorithm shift reported widely in the industry + 3 underperforming static posts. Action: shifted next month's plan to 70% video, added test of Carousel format, added 2 replies-per-post minimum to boost conversation rate." Transparency + corrective action beats positivity + hope.
Should I report platform-specific or cross-platform KPI rollups?
Both, in different sections. Executive summary and primary KPI should show cross-platform rollup. Supporting KPIs should show per-platform breakdown — platforms behave differently and a client who's only winning on LinkedIn should know that explicitly.
What's the best benchmarking source to cite in client reports?
Rival IQ for engagement rate by industry (2025 Social Media Industry Benchmark Report). Socialinsider for Instagram and cross-platform benchmarks (2026 Social Media Benchmarks). Hootsuite for broad multi-platform data (Social Media Benchmarks 2026). Sprout Social Index for consumer behavior (response time expectations, platform usage — 2025 Index). Cite the specific report, not the vendor generically.
What's the fastest way to set up KPI tracking for a new client?
- During onboarding (Week 1–2), pull last 90 days of baseline data per KPI from platform-native analytics. 2. Configure a unified dashboard in your agency's tool. 3. Set 30-day and 90-day targets based on baseline + industry benchmark. 4. Build the report template with agency branding. 5. Share a sample report with the client during kickoff so they can ask questions before the first real report is due. Full onboarding walkthrough in our social media agency client onboarding checklist.
Key Takeaways
- 15 KPIs, 4 buckets. Awareness, Engagement, Conversion, Audience & Operations. Every client report needs representation across all four — not 12 engagement metrics and zero conversion.
- One primary KPI per engagement. Tied to the client's main business objective. The other 4–6 are supporting metrics, not competing ones.
- Benchmarks or it didn't happen. Every reported number needs a comparison — platform average (Rival IQ, Socialinsider, Hootsuite), client's own 90-day baseline, or industry benchmark (Unbounce, Similarweb, Sprout Social Index).
- Disclose formulas. ER "by followers" is not the same as ER "by reach." Consistency across the report matters more than clever formula variance.
- Don't fabricate benchmarks. For Share of Voice, Conversation Rate, Amplification Rate, Audience Quality — there's no public industry benchmark. Say so. Report as trends against the client's own baseline instead.
- Response time is under-reported and high-stakes. 73% of consumers expect a sub-24-hour response, 42% within 60 minutes (Sprout Social Index 2025). Agencies that don't report response time leave a retention-risk KPI invisible.
- Video completion rate is the algorithmic KPI that matters most in short-form. TikTok, Reels, YouTube Shorts — without completion rate, the algorithm deprioritizes future distribution.
- Report what happened, why, what's next. Every KPI gets a one-line driver explanation and a one-line next-month action. Reports without "why" and "what's next" are spreadsheets in disguise.
Related Reading
- How to Start a Social Media Marketing Agency
- How Social Media Agencies Use AI in 2026: 15 Workflows
- 40 Social Media Agency Statistics to Know in 2026
- Client Engagement Metrics That Matter
- Social Media Engagement Rate Calculator Guide
- Social Media Analytics and Reporting
- Social Media Analytics for Business
- How to Create a Social Media Report
- ROI on Social Media
- How to Measure Social Media ROI
- Views vs. Impressions: Explained
- Social Media Impressions
- What Are Impressions on Instagram
- The 15-Step Social Media Agency Client Onboarding Checklist
- Best Social Media Tools for Managing Multiple Brands
- White-Label Social Media Reports for Clients
- Social Media Audit Template
- How Much to Charge for Social Media Management
- Best Social Media Analytics Tools
- Best Social Media Management Tools for Agencies
All your social media in one simple dashboard
Schedule posts, track analytics, and reply to comments/DMs — without switching tabs.
Engagement
+18%
Views
52.8k
About the Author

Hasan Cagli
Founder of PostPlanify, a content and social media scheduling platform. He focuses on building systems that help businesses, agencies, and teams plan, publish, and manage content and social media more efficiently across platforms.


