


TikTok analytics has two problems the platform never mentions. The first: native account analytics only reaches back 60 days, so every quarter-over-quarter comparison, every seasonal pattern, every "how did we do last year" question is unanswerable unless you exported the data in time. The second problem lives outside the app: search for "TikTok analytics tools" and half the results are follower counters that scrape a public profile, show you a vanity number, and call it analytics.
This guide sorts out both, with something the other roundups don't have: first-party data. We analyzed 6,138 TikTok videos from accounts on PostPlanify to measure how virality actually behaves at typical account sizes, and the numbers (further down this guide) contradict most of what gets written about TikTok. First: 8 tools that do real TikTok analytics, meaning they either connect to your account through TikTok's API or continuously track accounts to build history the native dashboard throws away.
Quick context for reading the numbers you'll find in these tools: in PostPlanify's analysis of 14,000+ posts across 580 small-to-mid-sized accounts, TikTok's median engagement rate was 1.62% per view. That sounds low next to Instagram's 3.87% until you remember what it means: TikTok shows your content to enormous audiences of non-followers, so the denominator explodes. TikTok buys you discovery. The judgment of each viewer is a separate metric.
Quick Answer: What Is the Best TikTok Analytics Tool in 2026?
For agencies serving local businesses, the best TikTok analytics tool is PostPlanify: TikTok account and post analytics with historical trends, period comparison, and benchmarking, stored from the day you connect (so the 60-day native limit stops mattering), plus TikTok scheduling, a social inbox, and white-label reports, from $39/mo per client workspace.
If you want a TikTok-only intelligence specialist, Exolyt tracks accounts, hashtags, and even sounds with sentiment analysis. For competitor benchmarking on a defined budget, Socialinsider starts at $82/month, and Metricool covers the basics from $25/month with a real free plan.
What TikTok's Native Analytics Gives You Free (and Where It Stops)
Every TikTok account gets free analytics (switch to a Business or Creator account, then Settings → Analytics, or use the desktop dashboard). It's genuinely useful: video views, watch time, average view duration, retention graphs, traffic sources, follower activity times, and demographics. Video-level metrics stay available from the day each video was posted.
The walls you'll hit:
- Account analytics covers a maximum 60-day window. The view options are 7, 28, or 60 days, and anything older than 60 days is gone from the account-level charts.
- No benchmarks. TikTok tells you a video got a 4% engagement rate but never whether that's good for your niche or size.
- No competitor view. You can watch a rival's videos, but their numbers stay hidden.
- Desktop exports exist but are snapshots. If you don't download regularly, the history is unrecoverable.
So the native dashboard answers "how is this video doing?" very well and "are we actually growing?" poorly. That second question is what the tools below exist for. For a quick read on where you stand right now, our free TikTok engagement calculator works instantly, and if your concern is earnings rather than reach, the TikTok money calculator covers that side.
How I Evaluated These TikTok Analytics Tools
TikTok breaks tools differently than other platforms: distribution swings hard, view counts dwarf follower counts, and half the "analytics" market is scraping public profiles. So the criteria lean on TikTok's specific failure modes:
- Data history: Does the tool build history beyond TikTok's 60-day window, and from when?
- Real analytics vs follower counting: API-connected account data, or scraped public numbers?
- TikTok-specific depth: Watch time, retention, and traffic sources, or just likes and comments?
- Benchmarks and competitors: Context for your numbers
- Reporting: Client-ready outputs, brandable or not
- Workflow: Analytics alone, or connected to scheduling and engagement
Quick Picks: Best TikTok Analytics Tools at a Glance
| Tool | Starting Price | Free Option | Data History | Best For |
|---|---|---|---|---|
| PostPlanify | From $39/mo per workspace | Trial + guarantee | From connection | Agencies serving local businesses |
| Exolyt | $400/mo ($330 annual) | Free plan | Up to 1+ year | TikTok-first brands & researchers |
| Socialinsider | $82/mo | 14-day trial | 3-12 months by plan | Competitor benchmarking |
| Metricool | $25/mo | ✅ (1 brand) | Unlimited (paid) | Budget data depth |
| Iconosquare | $39/mo | ✅ (2 profiles) | Extensive | Multi-platform analysts |
| Later | $25/mo | Trial | Plan-dependent | Creators & visual brands |
| Sprout Social | $99/seat/mo | Trial | Deep | Enterprise teams |
| Hootsuite | $99/user/mo | Trial | Deep | Enterprise breadth |
1. PostPlanify: Best for Agencies Serving Local Businesses
PostPlanify is a social media management platform built for agencies serving local businesses, and it treats TikTok analytics as part of the job rather than the whole job. It tracks your TikTok account and post performance (views, likes, comments, shares, engagement trends) with historical data stored from the day you connect, period-over-period comparison, and benchmarking, and it puts the results next to the tools you act with: a TikTok scheduler with direct publishing, a social inbox with AI replies, approval workflows, and white-label reports for client work.
That combination matters more on TikTok than anywhere else, because TikTok performance swings hard week to week. Seeing a dip is native-dashboard territory; knowing whether it's a real trend, an algorithm shift, or normal variance takes history the native dashboard deletes at day 61.
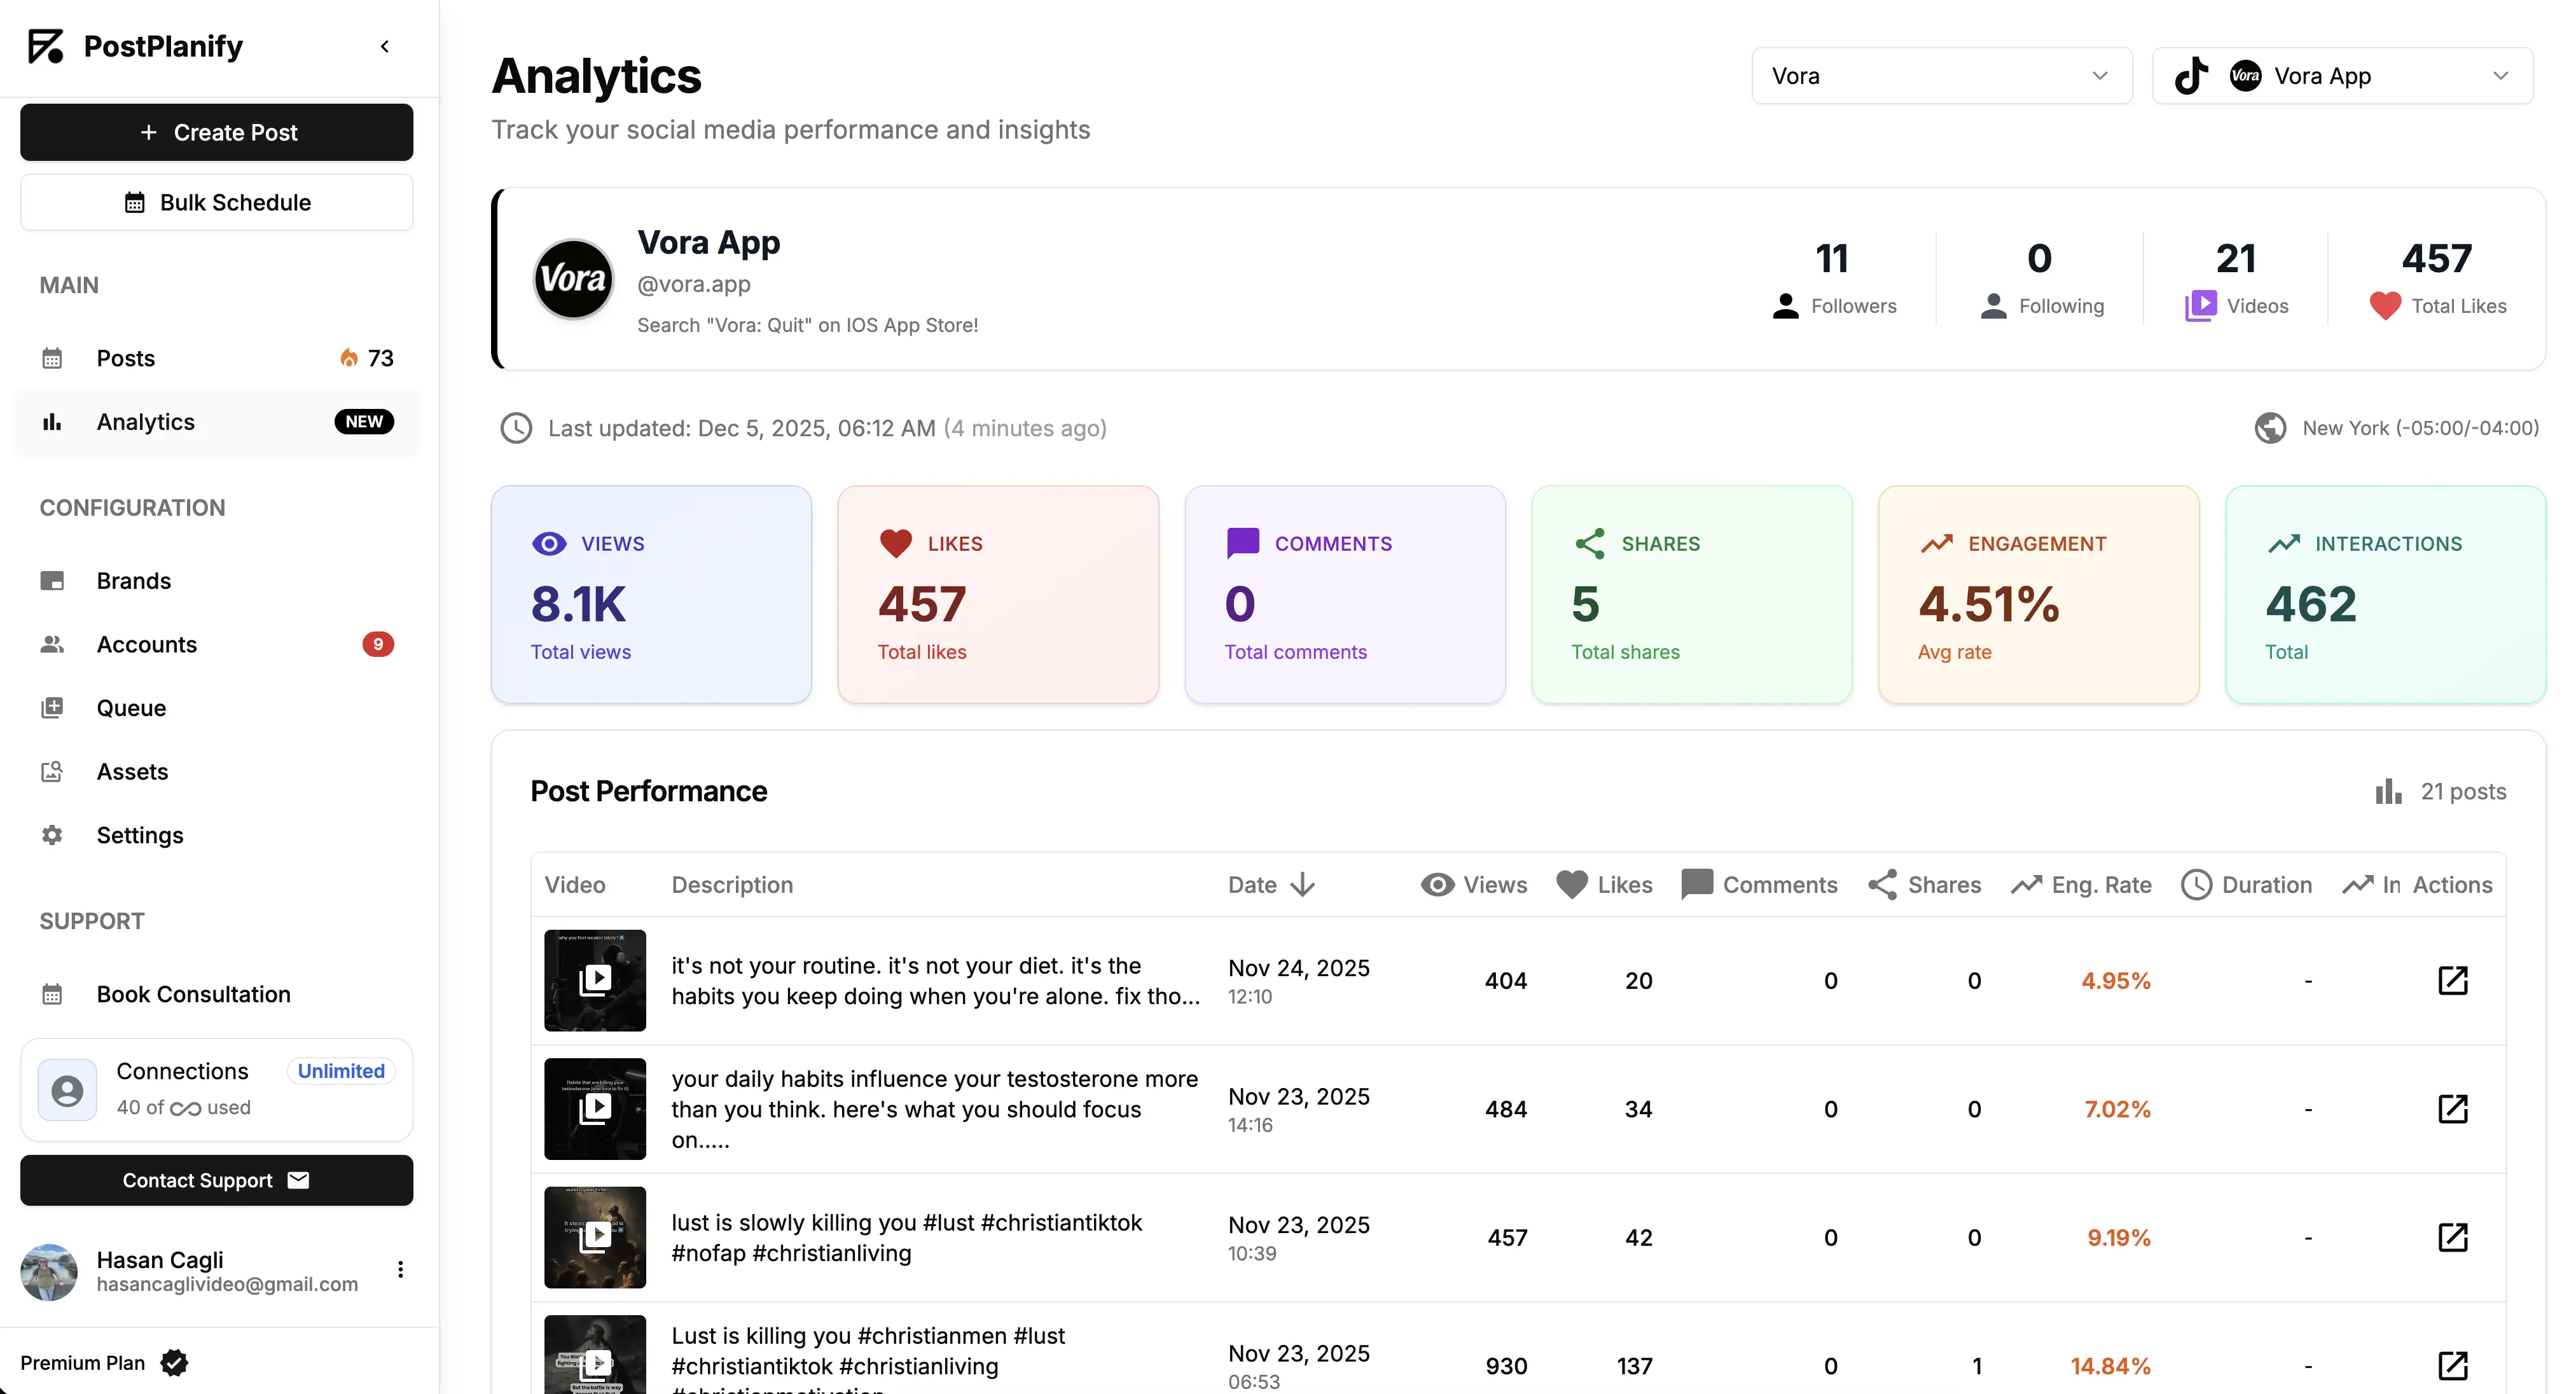
At a glance: PostPlanify
- Pricing: Per client workspace and graduated: Growth from $39/mo (4 accounts per workspace), Premium from $99/mo (6 accounts), Scale from $199/mo (8 accounts). Three client workspaces run $97/mo, ten run $250/mo
- Free option: 7-day free trial + 14-day money-back guarantee
- Data history: Stored from the day you connect, across all 10 supported platforms
- Team members: Unlimited on every plan, client approvers included
- Best for: Agencies running TikTok for local-business clients that want analytics, scheduling, engagement, and client reporting per client in one tool
Key features:
- Full analytics with historical trends: account growth and post performance over any stored period, with period comparison
- Benchmarking so a 1.6% engagement rate reads as "median" instead of "mystery"
- Best times to post calculated from your own audience data (compare with our researched TikTok timing guide)
- Client reports on Premium, fully white-labeled on Scale with shareable links
- The full workflow: TikTok scheduling with direct publish, a social inbox, approval workflows on Premium, and an AI assistant for captions and images
- 9 more platforms in the same dashboard, including Instagram, YouTube, and Google Business Profile
The honest drawback: PostPlanify doesn't do TikTok-wide intelligence. There's no hashtag research, no sound tracking, no influencer database. It analyzes your accounts (and your clients'), not the platform at large. If you need market-level TikTok research, pair it with a specialist like Exolyt.
Verdict: The strongest pick when TikTok analytics needs to end in action: better posting decisions, faster client reports, and history that survives. Platform-wide research tools go wider; nothing here connects your own data to your workflow better.
 PostPlanify
All your social media in one simple dashboard
Schedule posts, track analytics, and reply to comments/DMs without switching tabs.

Engagement
+18%
Views
52.8k
2. Exolyt: Best TikTok-Only Analytics Specialist
Exolyt is what happens when a whole product is built for one platform. It's a TikTok intelligence tool: account monitoring, hashtag tracking, sound analytics, influencer campaign measurement, social listening, and AI sentiment analysis, all TikTok-only. Because it tracks accounts continuously, it builds the long-term history TikTok deletes, with 90-day history on the mid tier and over a year on the top tier.
It's aimed at brands, agencies, and researchers who treat TikTok as a market to study, not just a channel to post on. Pricing reflects that positioning: plans are tiered by tracked accounts (50 on Essentials at $400/mo, 300 on Advanced at $950/mo), which puts it in a different budget class than the schedulers on this list.
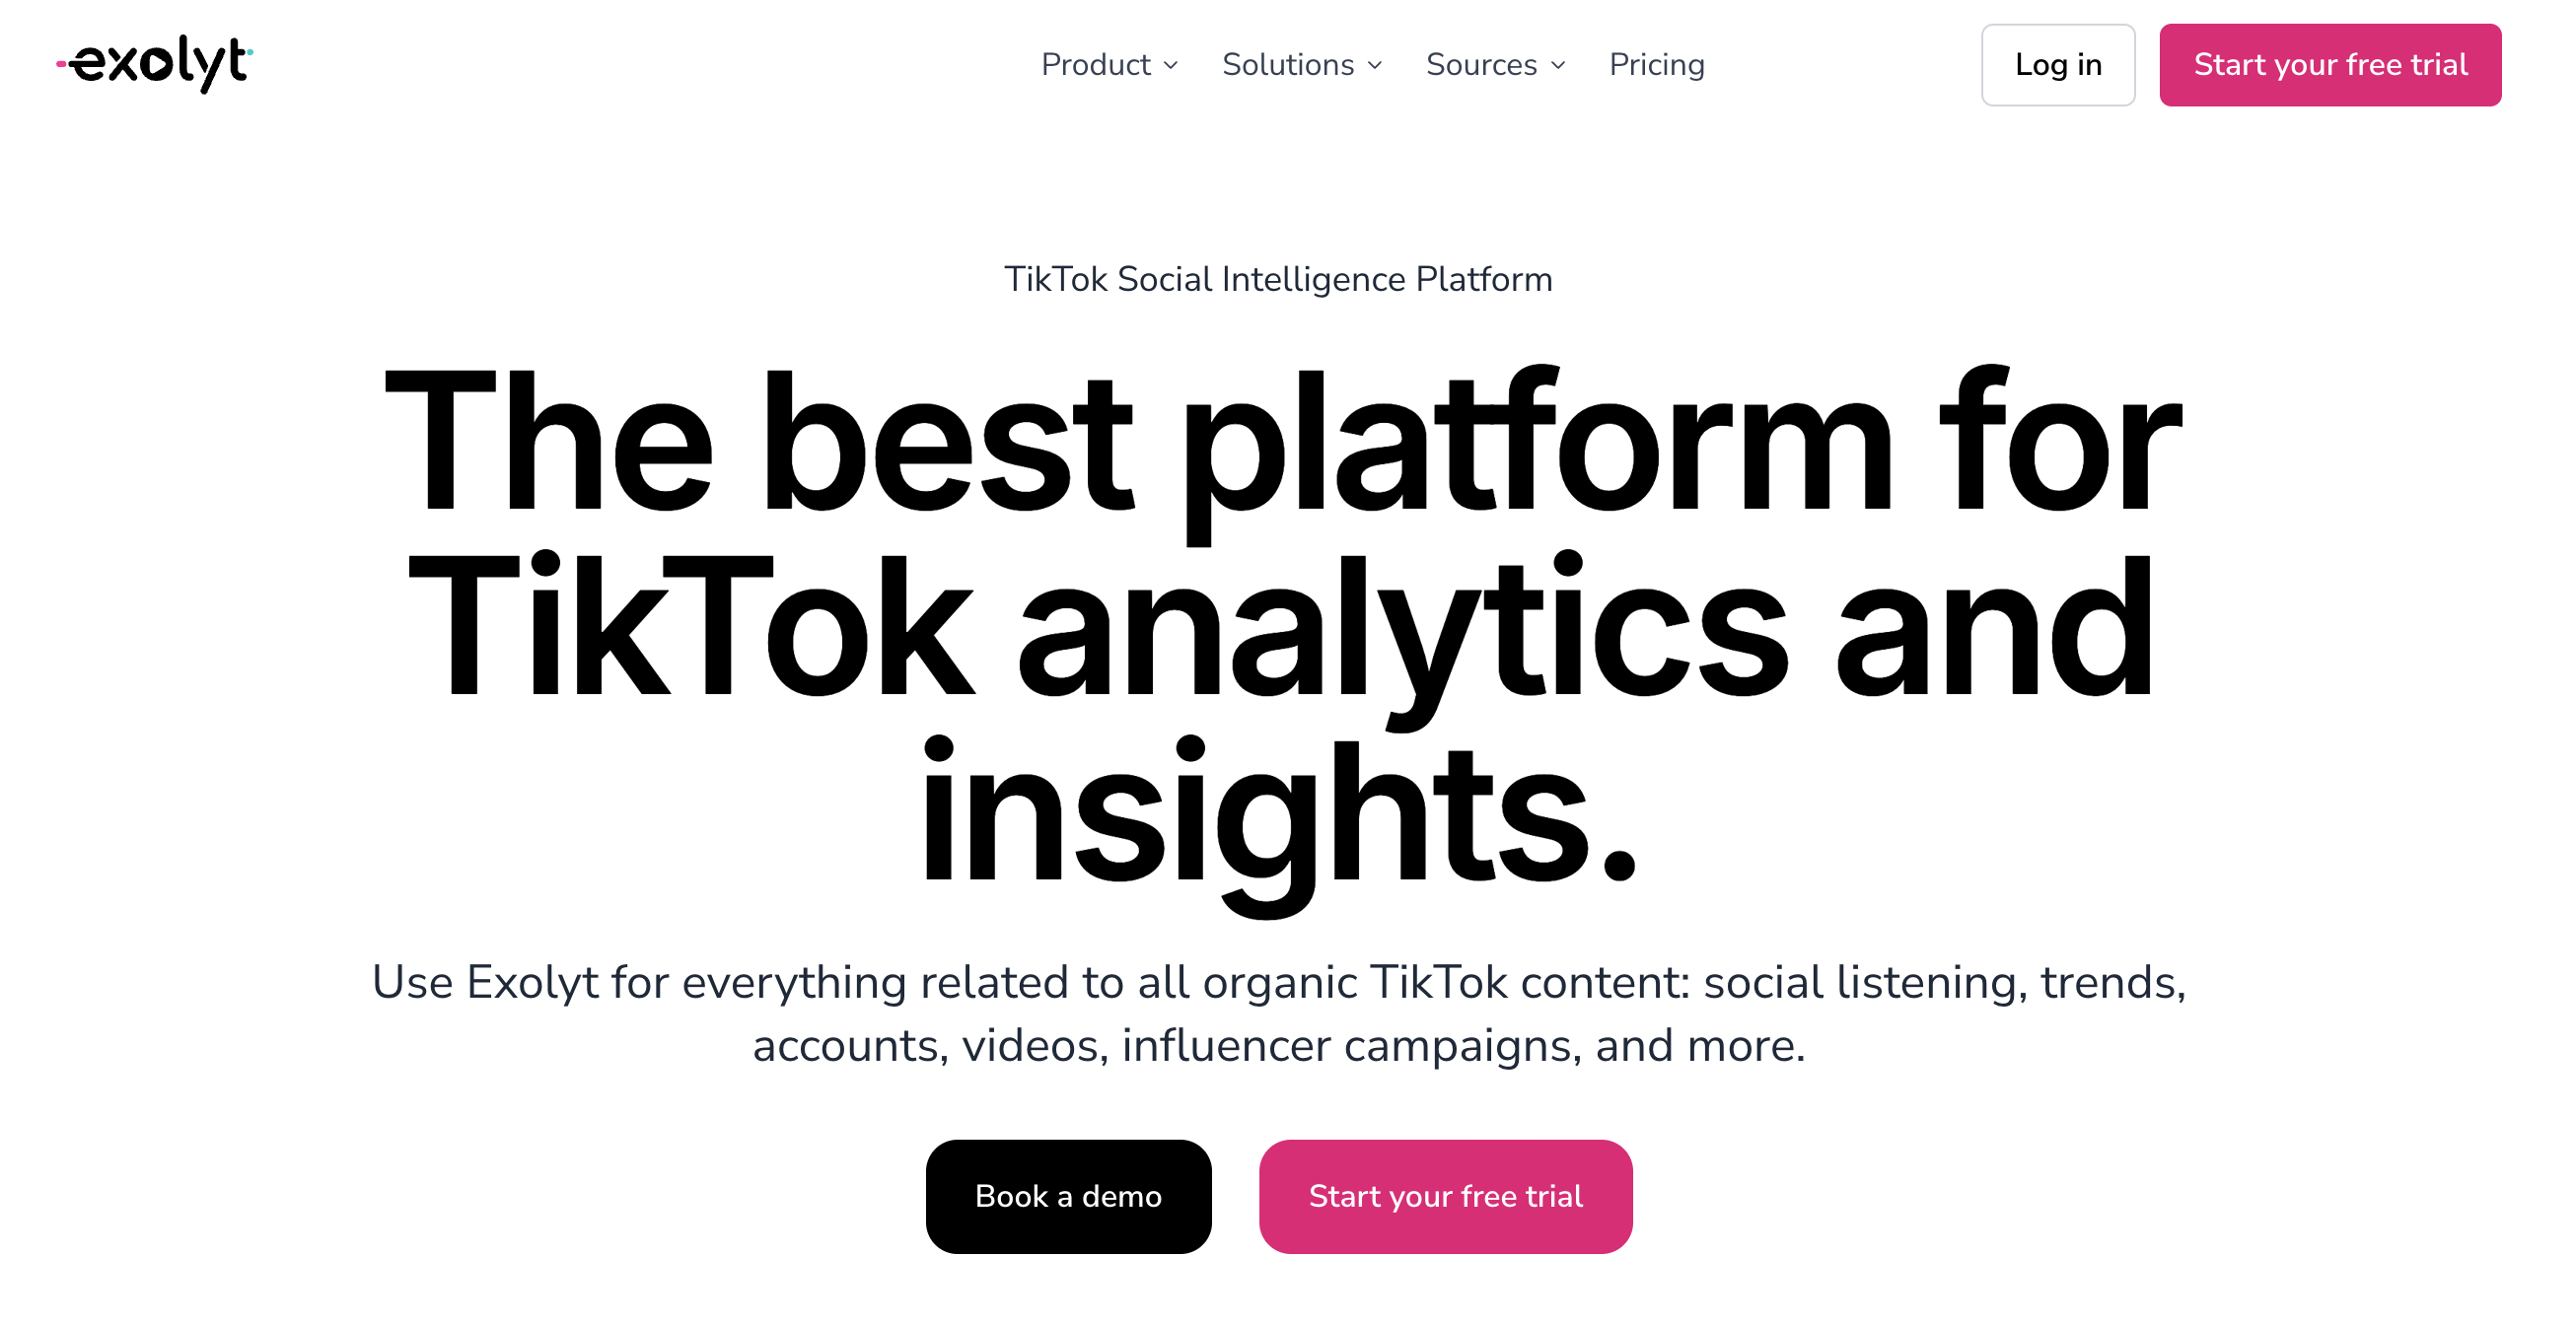
At a glance: Exolyt
- Pricing: Basic free (1 tracked hashtag, no listening projects) → Essentials $400/mo, or $330/mo billed annually (50 tracked accounts, 50 hashtags, 3 listening projects) → Advanced $950/mo, or $790/mo annually (300 accounts, 300 hashtags, 15 listening projects, AI analysis) → custom beyond that
- Free option: A free Basic plan with 1 tracked hashtag, no card required
- Data history: 90 days to 1+ year depending on tier
- Best for: TikTok-first brands, agencies, and researchers who need platform-wide intelligence, not just their own numbers
Key features:
- TikTok-only depth: hashtags, sounds, trends, and creator discovery
- Continuous account tracking that builds history beyond the 60-day native limit
- Social listening and AI sentiment analysis for brand monitoring
- Influencer campaign measurement with an influencer database
The honest drawback: it's TikTok-only by design and priced for teams; if you manage five platforms for clients, this is your second tool, not your first.
Verdict: The specialist to shortlist when TikTok is the strategy, not a channel. Nothing else here matches its platform-wide depth.
3. Socialinsider: Best for Competitor Benchmarking
Socialinsider is the benchmarking tool whose industry studies you've probably already read; their engagement research is among the most-cited in social media marketing (we cite it ourselves in our engagement benchmarks breakdown). The product behind the studies does the same thing for your accounts: cross-network analytics with TikTok explicitly supported, competitor benchmarking as the core workflow, automated reports, and unlimited exports.
Plans are sized by tracked accounts and history depth: 20 accounts with 3 months of history on Adapt ($82/month), up to 40 accounts with 12 months on Predict ($199/month). The 14-day trial needs no card.
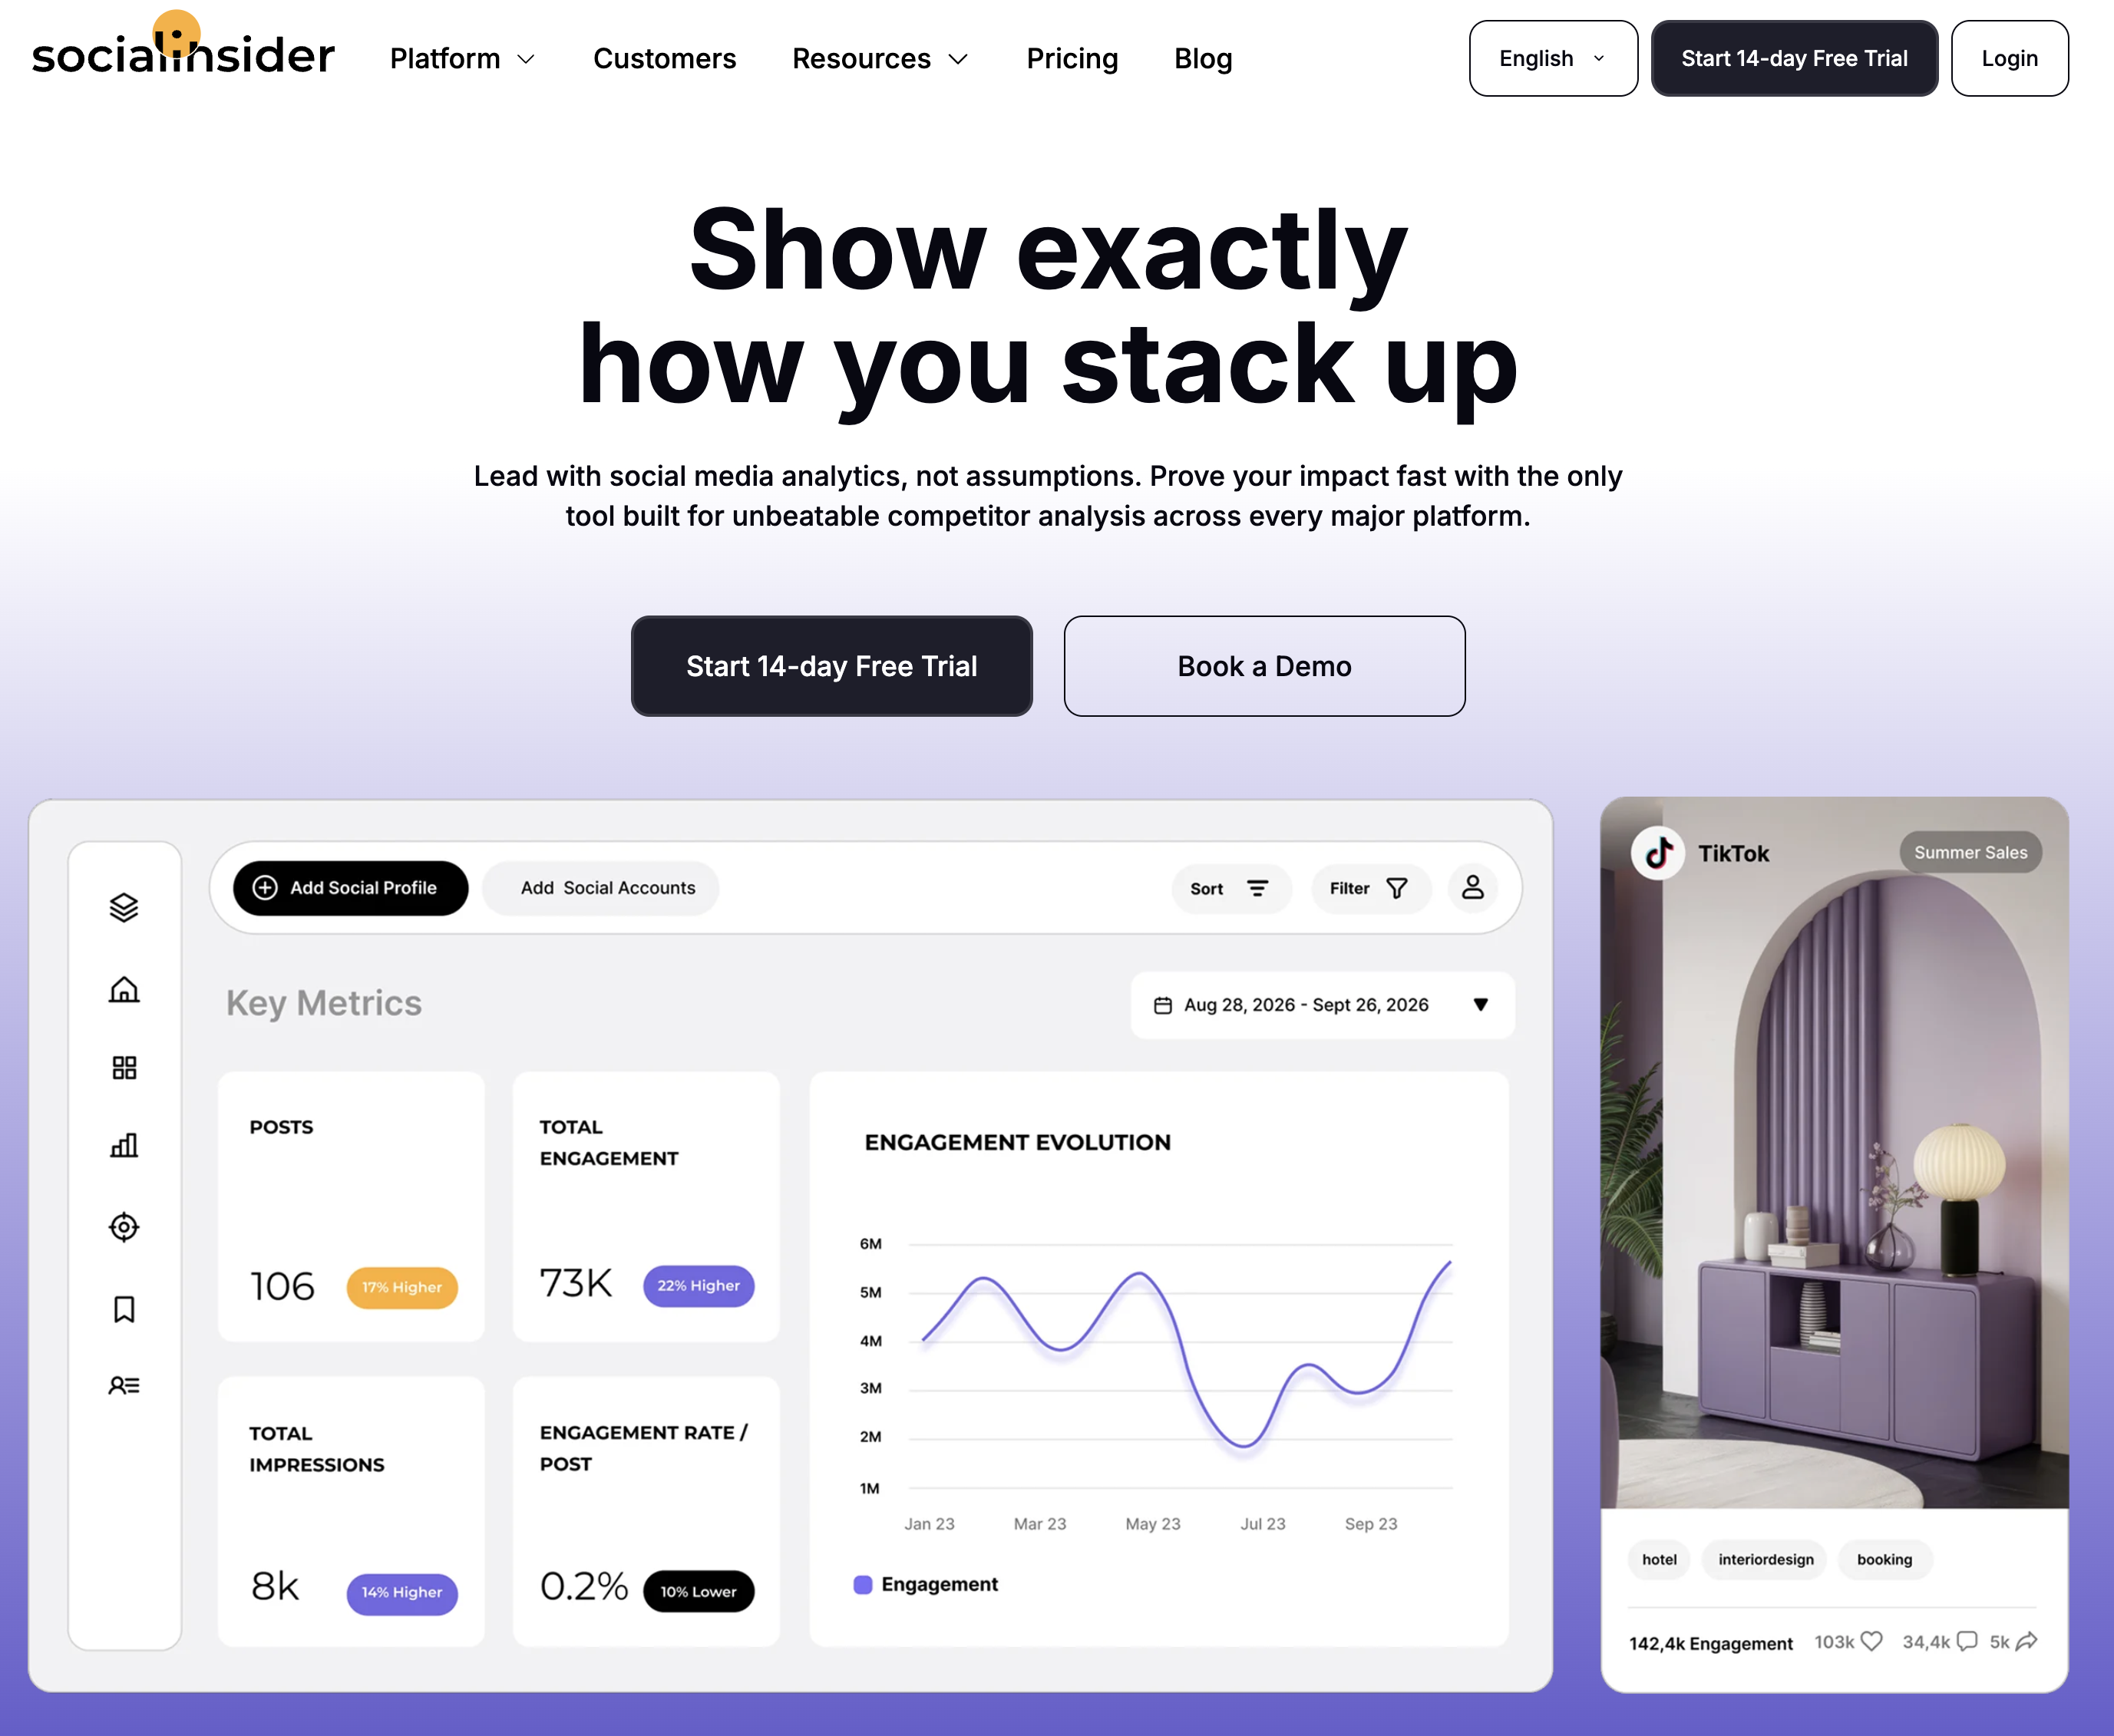
At a glance: Socialinsider
- Pricing: Adapt $82/mo (20 accounts, 3-month history) → Optimize $124/mo (30 accounts, 6 months) → Predict $199/mo (40 accounts, 12 months); ~2 months free on annual
- Free option: 14-day trial, no card required
- Data history: 3 to 12 months depending on plan
- Best for: Marketers whose main question is "how do we compare?"
Key features:
- Competitor benchmarking across TikTok, Instagram, Facebook, LinkedIn, X, and YouTube
- Automated reports with unlimited exports
- Industry benchmark context from their own research datasets
- Add-ons for API and Looker Studio access
The honest drawback: it's analytics-only (no publishing, no inbox), and the per-account caps with monthly "replacement" limits take reading before you buy.
Verdict: The strongest pure benchmarking play in this price range. If your reports live and die by competitor context, start the trial here.
4. Metricool: Best Budget Analytics With Unlimited History
Metricool gives TikTok the same treatment it gives every platform: solid analytics, unlimited data history on paid plans, competitor tracking, and a capable planner, at the lowest serious price in the category. The free plan covers one full brand, which makes it the easiest way to start storing TikTok history today at zero cost.
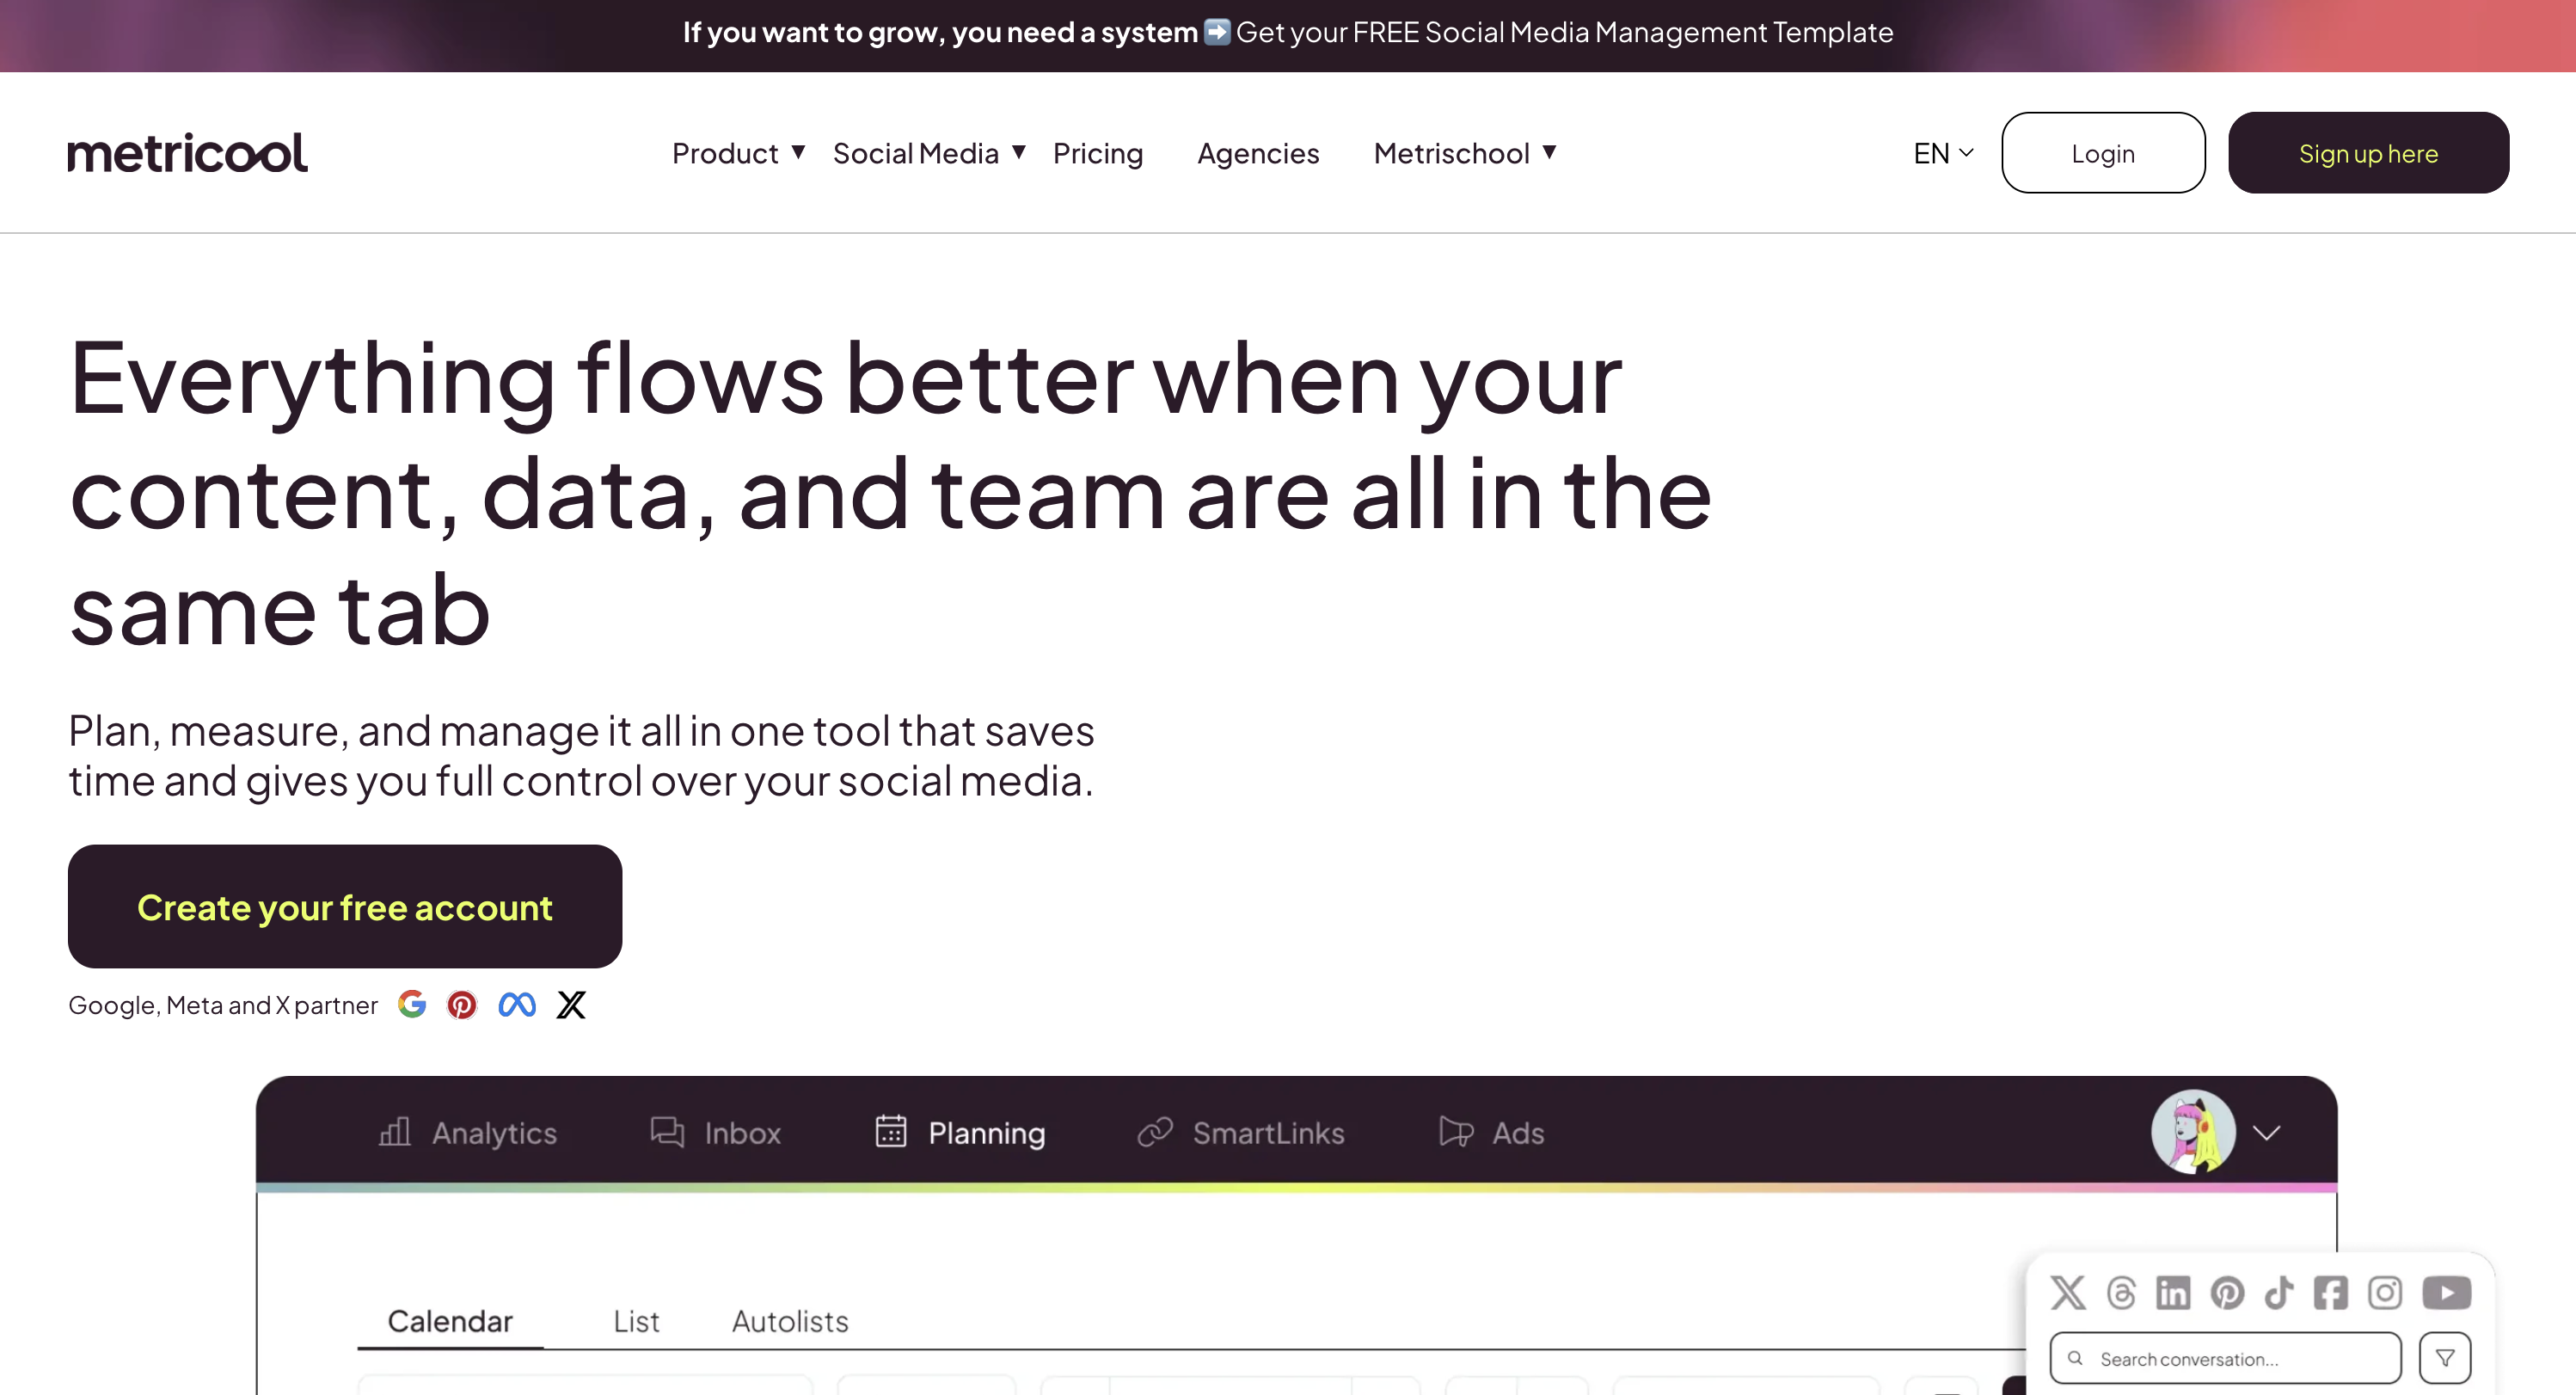
At a glance: Metricool
- Pricing: Free (1 brand, 30-day history, 20 posts/mo) → Starter from $25/mo (up to 10 brands) → Advanced from $67/mo (up to 50 brands)
- Free option: Yes, 1 full brand
- Data history: Unlimited on paid plans
- User ratings: 4.5/5 on G2 (83 reviews); 4.2/5 on Trustpilot
- Best for: Budget-conscious marketers and small agencies that want data depth without specialist prices
Key features:
- Unlimited analytics history on paid plans
- TikTok among 11 supported platforms including Twitch and Google Business Profile
- Competitor tracking and client reports (Advanced)
- Planner and publishing included
The honest drawback: TikTok-specific depth is thinner than the specialists; you get the important metrics, not sounds, hashtags, or platform-wide trends. The X/Twitter add-on ($5/mo) and fair-use publishing limits are the fine print.
Verdict: The best data-per-dollar ratio here. Learn more in our Metricool pricing breakdown, Metricool reviews roundup, and best Metricool alternatives guide.
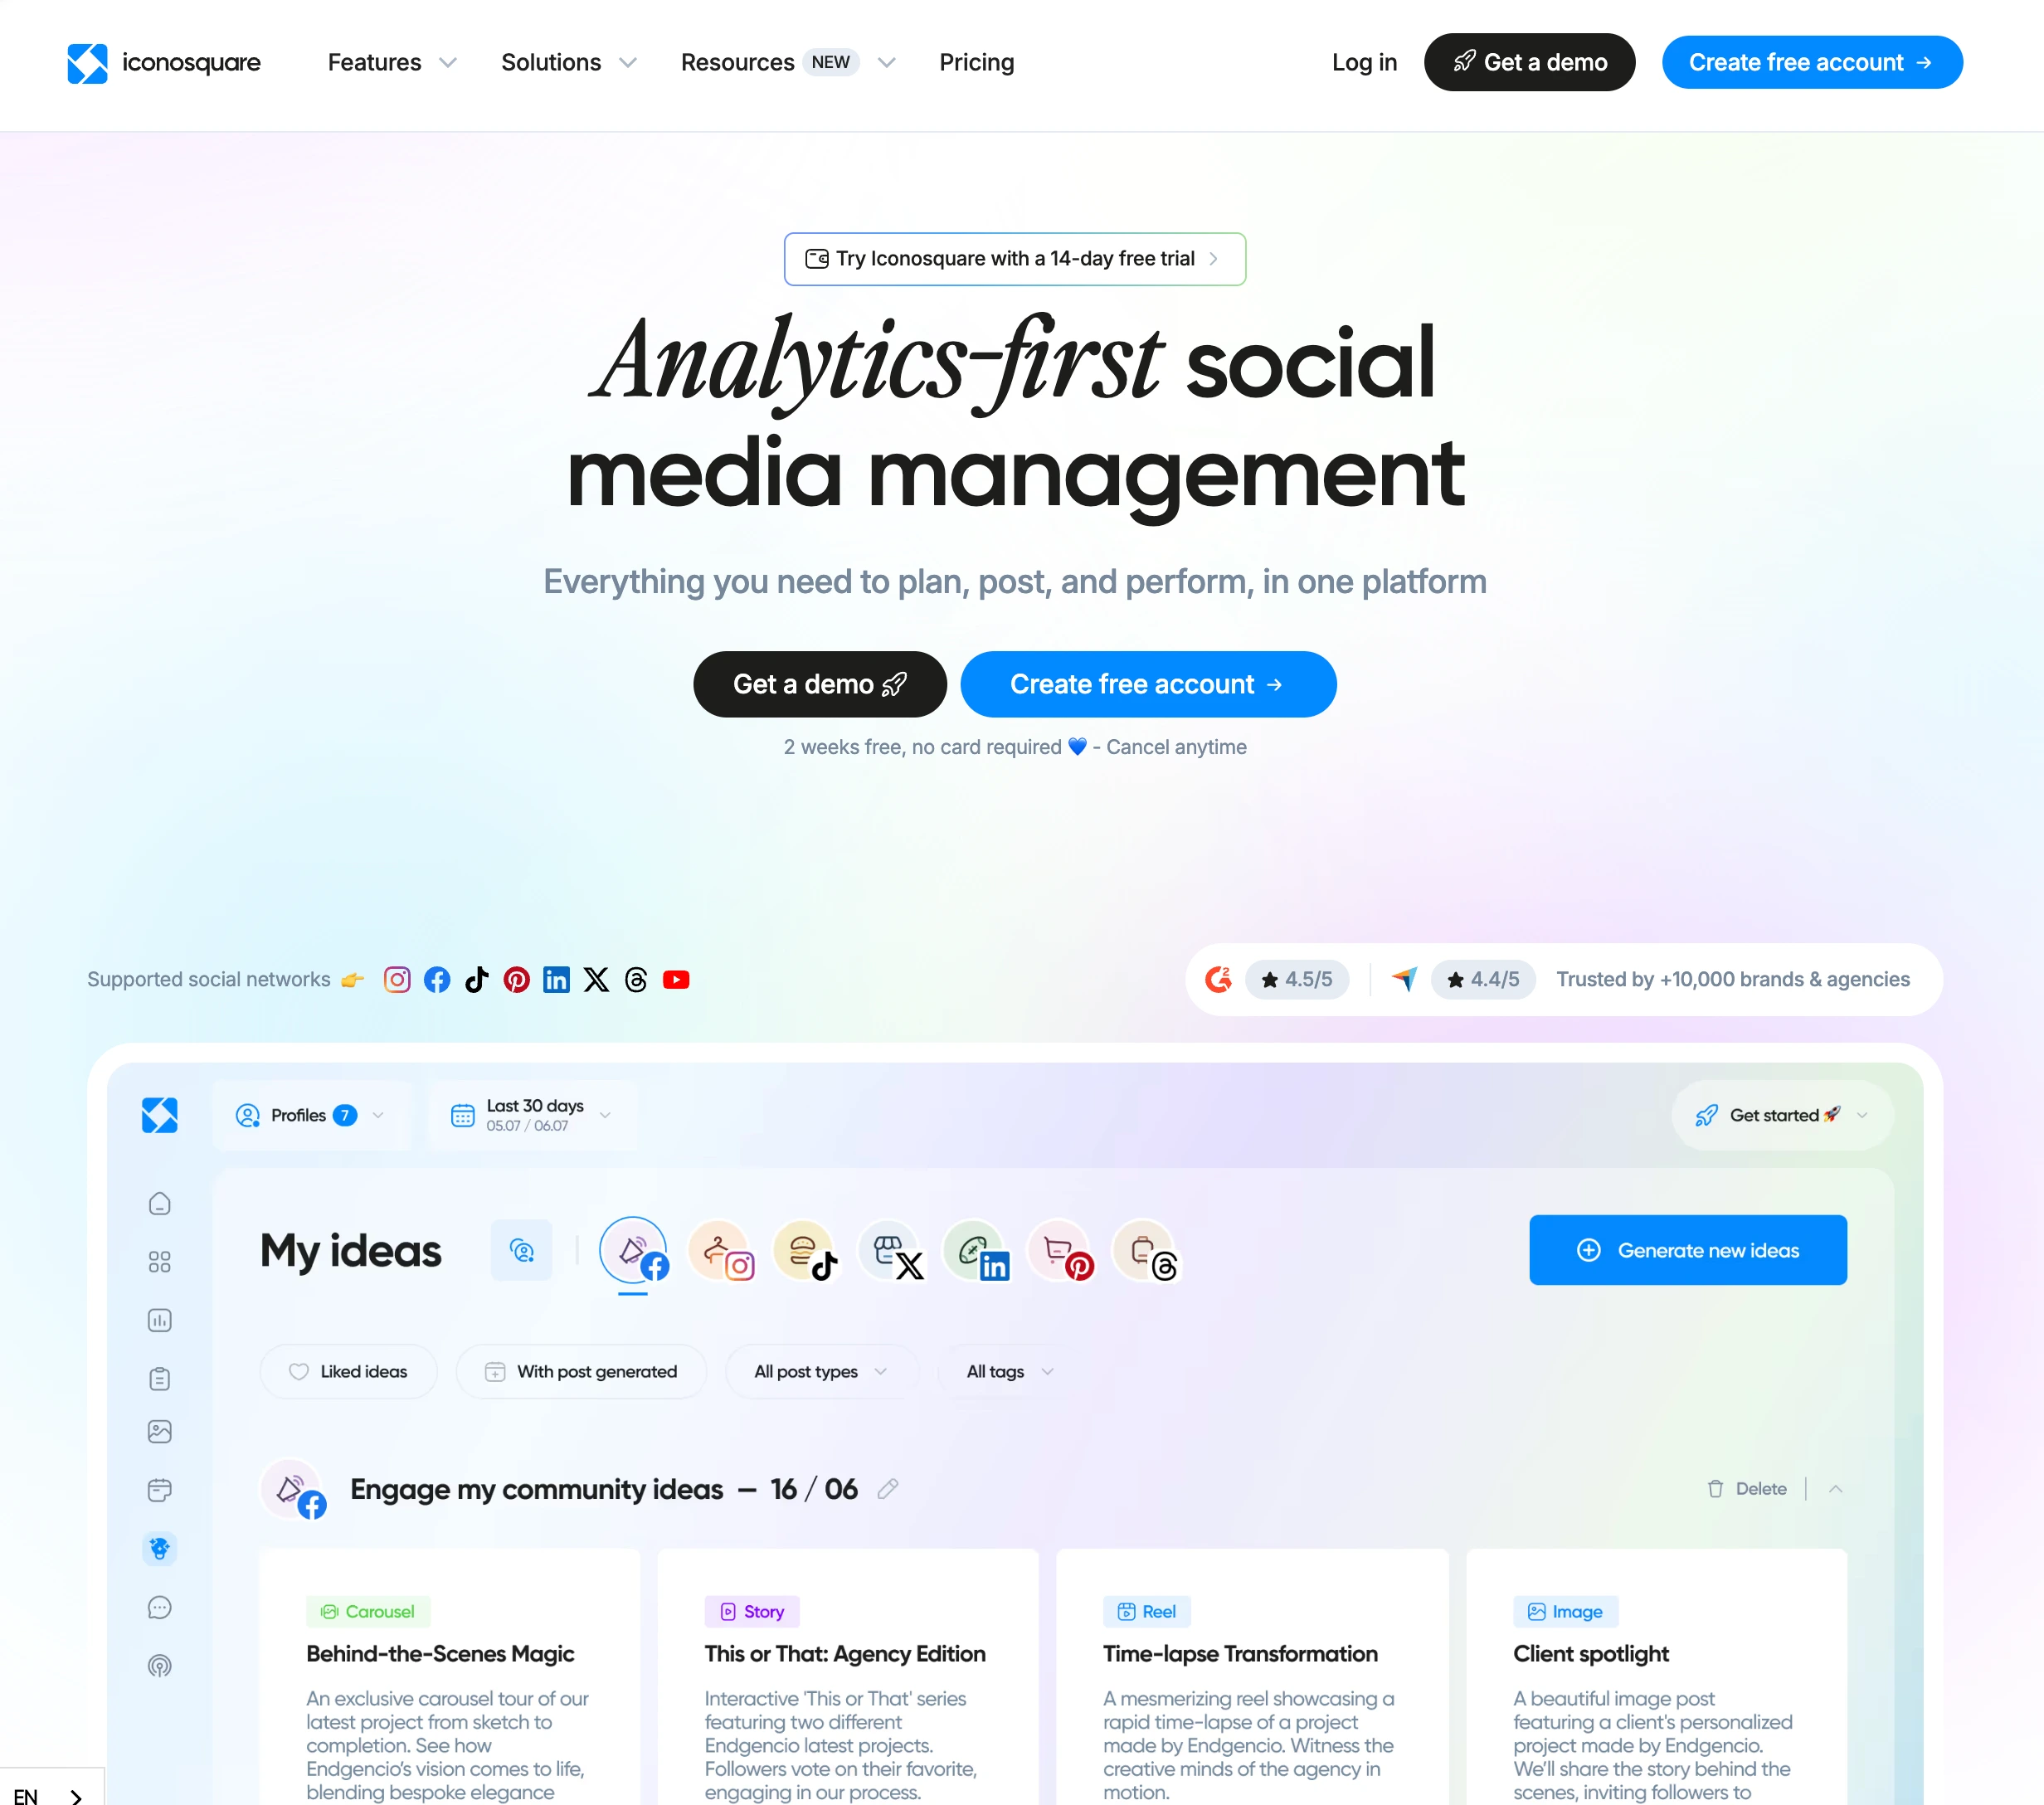
5. Iconosquare: Best Multi-Platform Analytics Specialist
Iconosquare brings its analytics-first DNA to TikTok alongside Instagram, Facebook, and 5 more platforms. You get advanced metrics, competitor tracking, industry benchmarks, and scheduled exportable reports, in a tool used by 10,000+ brands whose entire reputation is analytics depth.
For TikTok specifically it sits between the suites and the specialists: deeper than the all-in-one platforms on metrics and benchmarks, but without Exolyt's platform-wide hashtag and sound intelligence.
At a glance: Iconosquare
- Pricing: Free (2 profiles, 10 posts/profile) → Launch $39/mo (5 profiles) → Scale $83/mo (3 users) → Excel $139/mo (6 users); annual saves ~22%
- Free option: Yes, 2 profiles with limited features
- Data history: Extensive stored history once connected
- User ratings: 4.5/5 on G2 (135 reviews)
- Best for: Analysts covering TikTok plus Instagram and Facebook in one specialist tool
Key features:
- Advanced TikTok metrics with stored history
- Competitor tracking and industry benchmarks
- Scheduled PDF/Excel reports
- Custom dashboards across 8 platforms
The honest drawback: publishing and engagement are afterthoughts, and the per-profile slider raises the price fast for agencies with many accounts.
Verdict: The right specialist if TikTok is one of two or three platforms you analyze deeply. Learn more in our Iconosquare pricing breakdown, Iconosquare reviews roundup, and best Iconosquare alternatives guide.
6. Later: Best for Visual-First Creators
Later covers TikTok with the same creator-first approach it built on Instagram: plan content visually, schedule it, then check what performed and when your audience is active. The analytics answer creator questions (what worked, when to post) rather than analyst questions (why, versus whom, over what period).

At a glance: Later
- Pricing: Starter $25/mo (1 social set, 30 posts/profile) → Growth $50/mo → Scale $110/mo; annual saves ~17%
- Free option: Trial on paid tiers
- Data history: Scales with plan tier
- User ratings: 4.5/5 on G2 (347 reviews); 1.3/5 on Trustpilot
- Best for: Creators and visual brands running TikTok alongside Instagram
Key features:
- Visual content planning with scheduling for TikTok, Instagram, and Pinterest
- Post performance analytics and best-time suggestions
- Link in Bio page with click tracking
The honest drawback: analytics depth is tied to plan tier, and the 30-posts-per-profile cap on Starter arrives quickly for TikTok's posting pace.
Verdict: Pick it for the planning workflow with analytics as the companion. Learn more in our Later pricing breakdown, Later reviews roundup, and best Later alternatives guide.
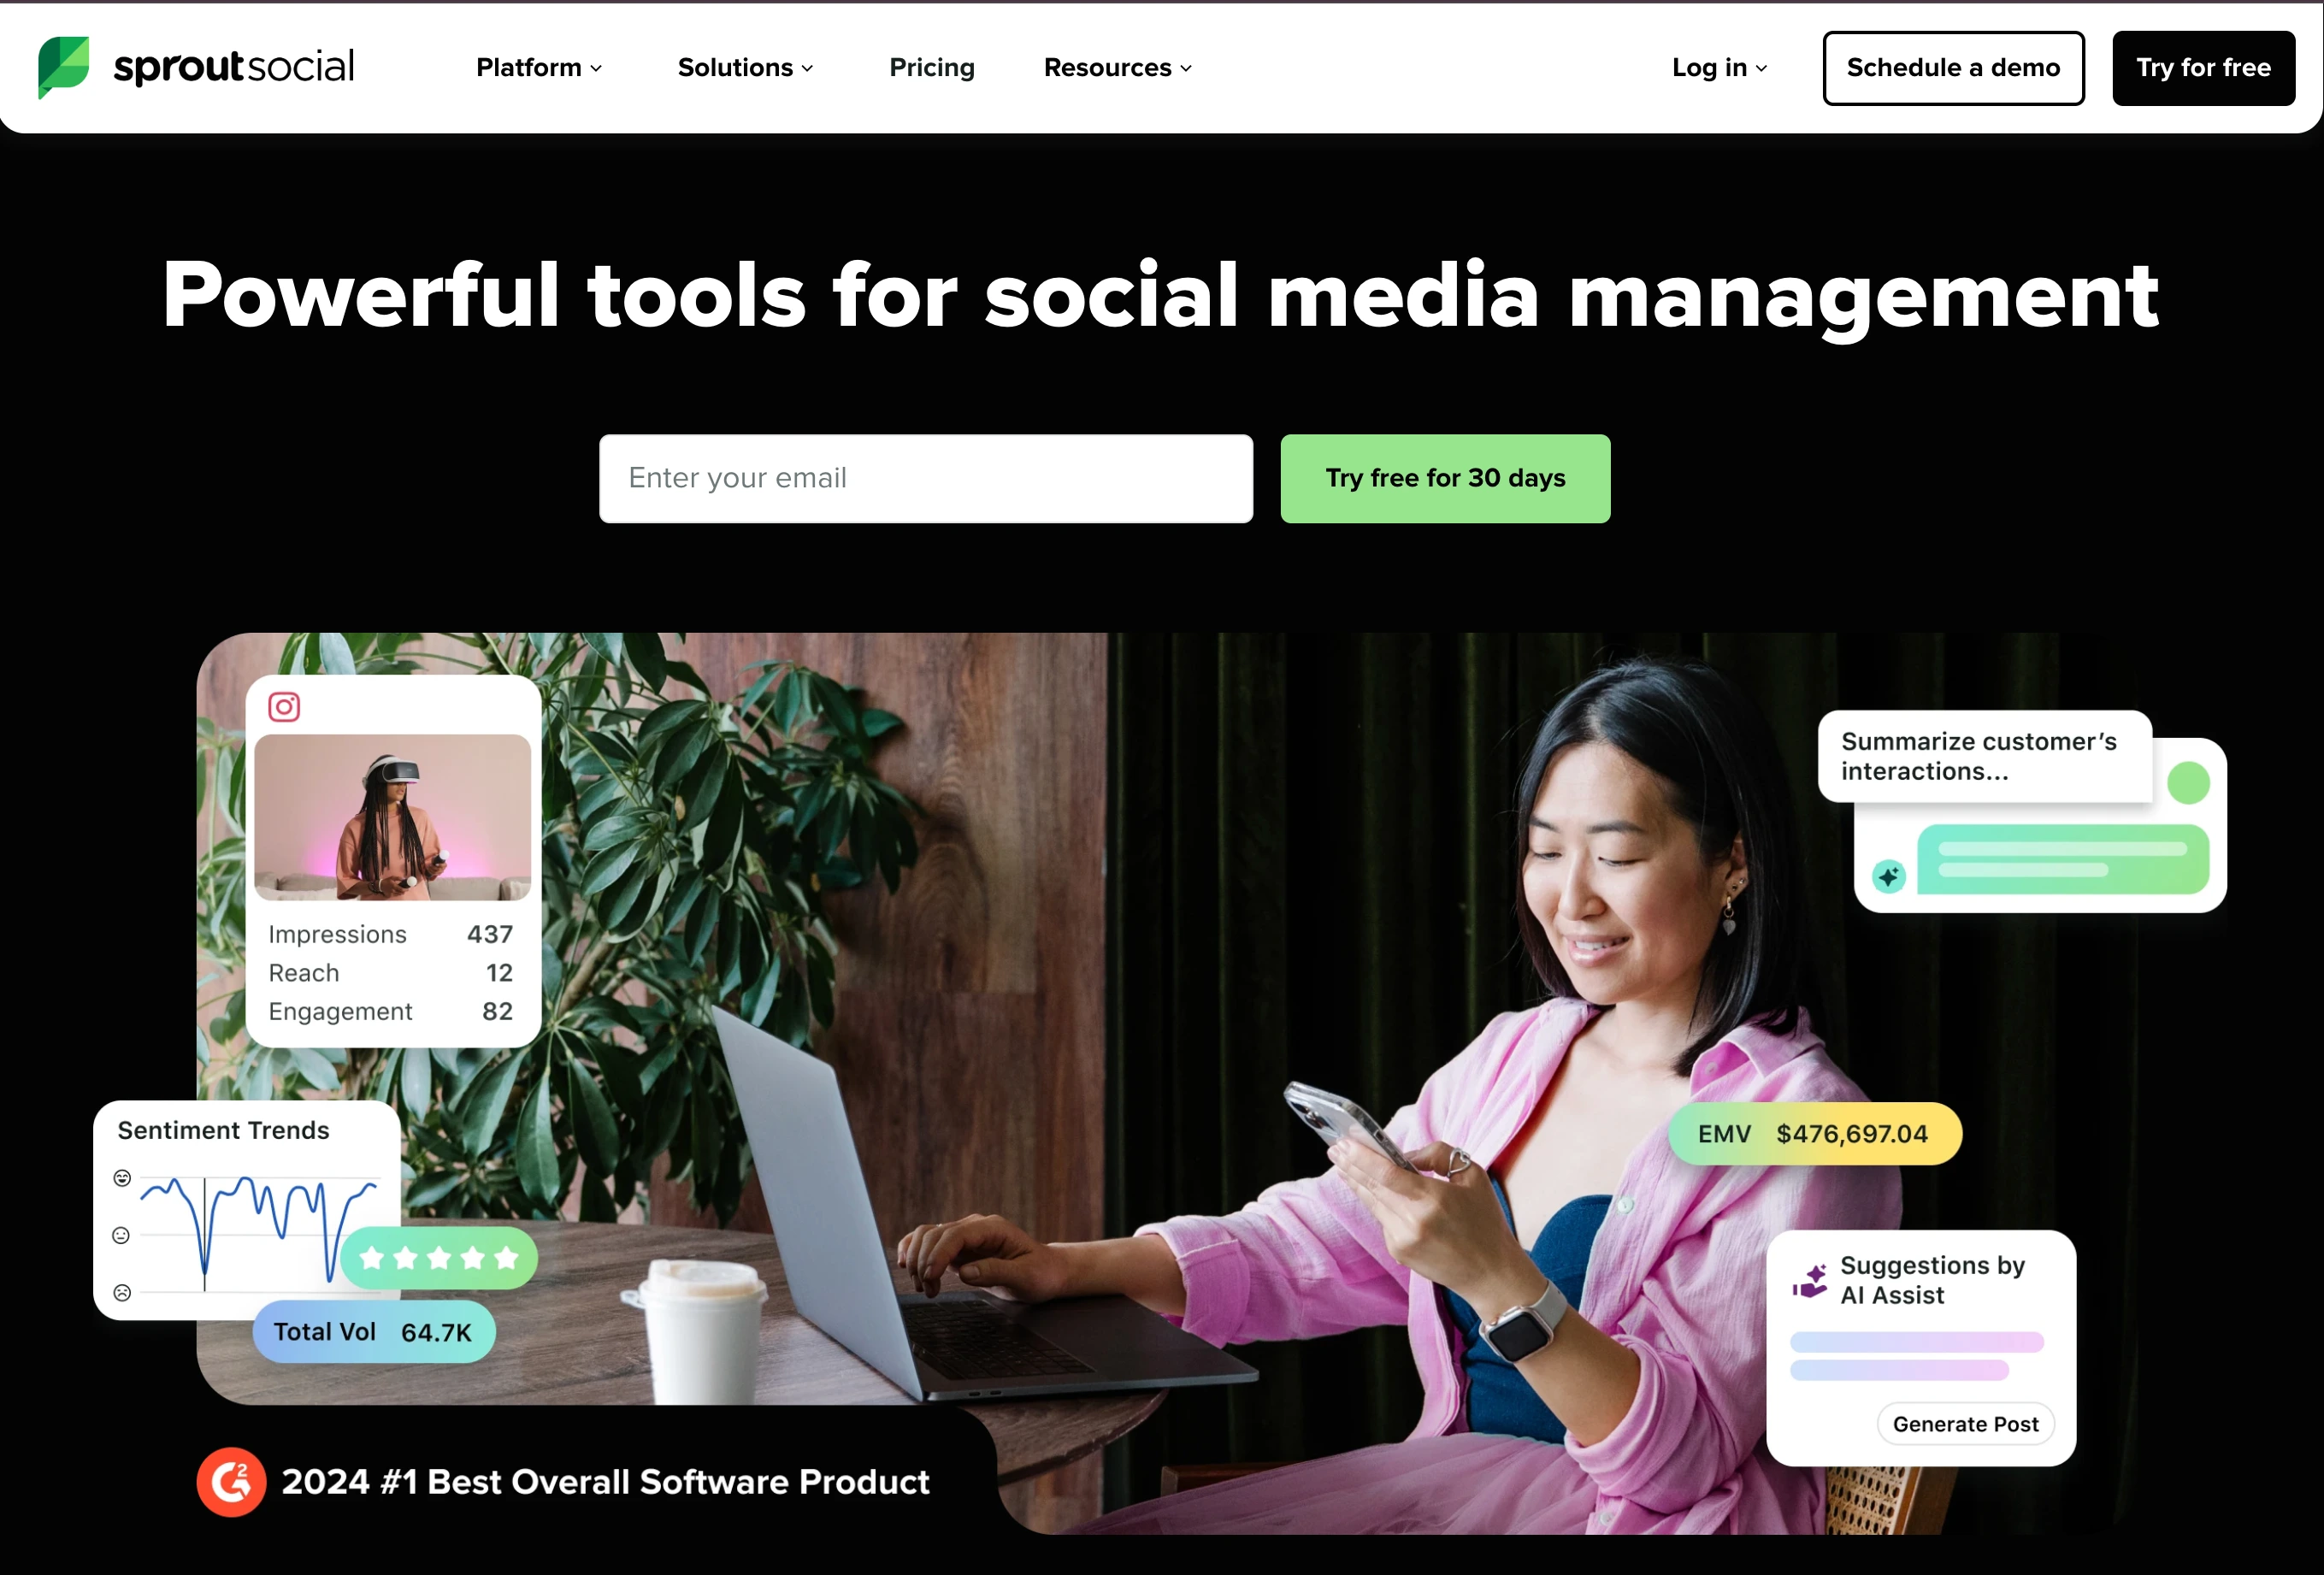
7. Sprout Social: Best Enterprise Analytics
Sprout Social handles TikTok inside the most polished enterprise reporting suite in the industry: cross-network dashboards, deep audience analysis, listening add-ons, and reports designed for stakeholders. If TikTok data needs to appear in a board deck next to five other networks, this is the incumbent standard.
At a glance: Sprout Social
- Pricing: Essentials $99/seat/mo, or $79 billed annually (5 profiles) → Standard $199/seat/mo (5 profiles) → Professional $299/seat/mo (unlimited profiles) → Advanced $399/seat/mo; custom Enterprise
- Free option: 30-day trial
- Data history: Deep, with premium reporting
- User ratings: 4.4/5 on G2 (5,731 reviews); 2.2/5 on Trustpilot
- Best for: Mid-market and enterprise teams with reporting obligations
Key features:
- Best-in-class cross-network reports including TikTok
- Deep audience and post analytics
- Social listening add-on for platform-wide context
- Enterprise workflows and permissions
The honest drawback: per-seat pricing makes a 3-person team $597/month before add-ons; below enterprise scale you're funding governance you won't use.
Verdict: If TikTok has to sit in a board deck next to five other networks, this is the report generator the board already trusts. Learn more in our Sprout Social pricing breakdown, Sprout Social reviews roundup, and best Sprout Social alternatives guide.
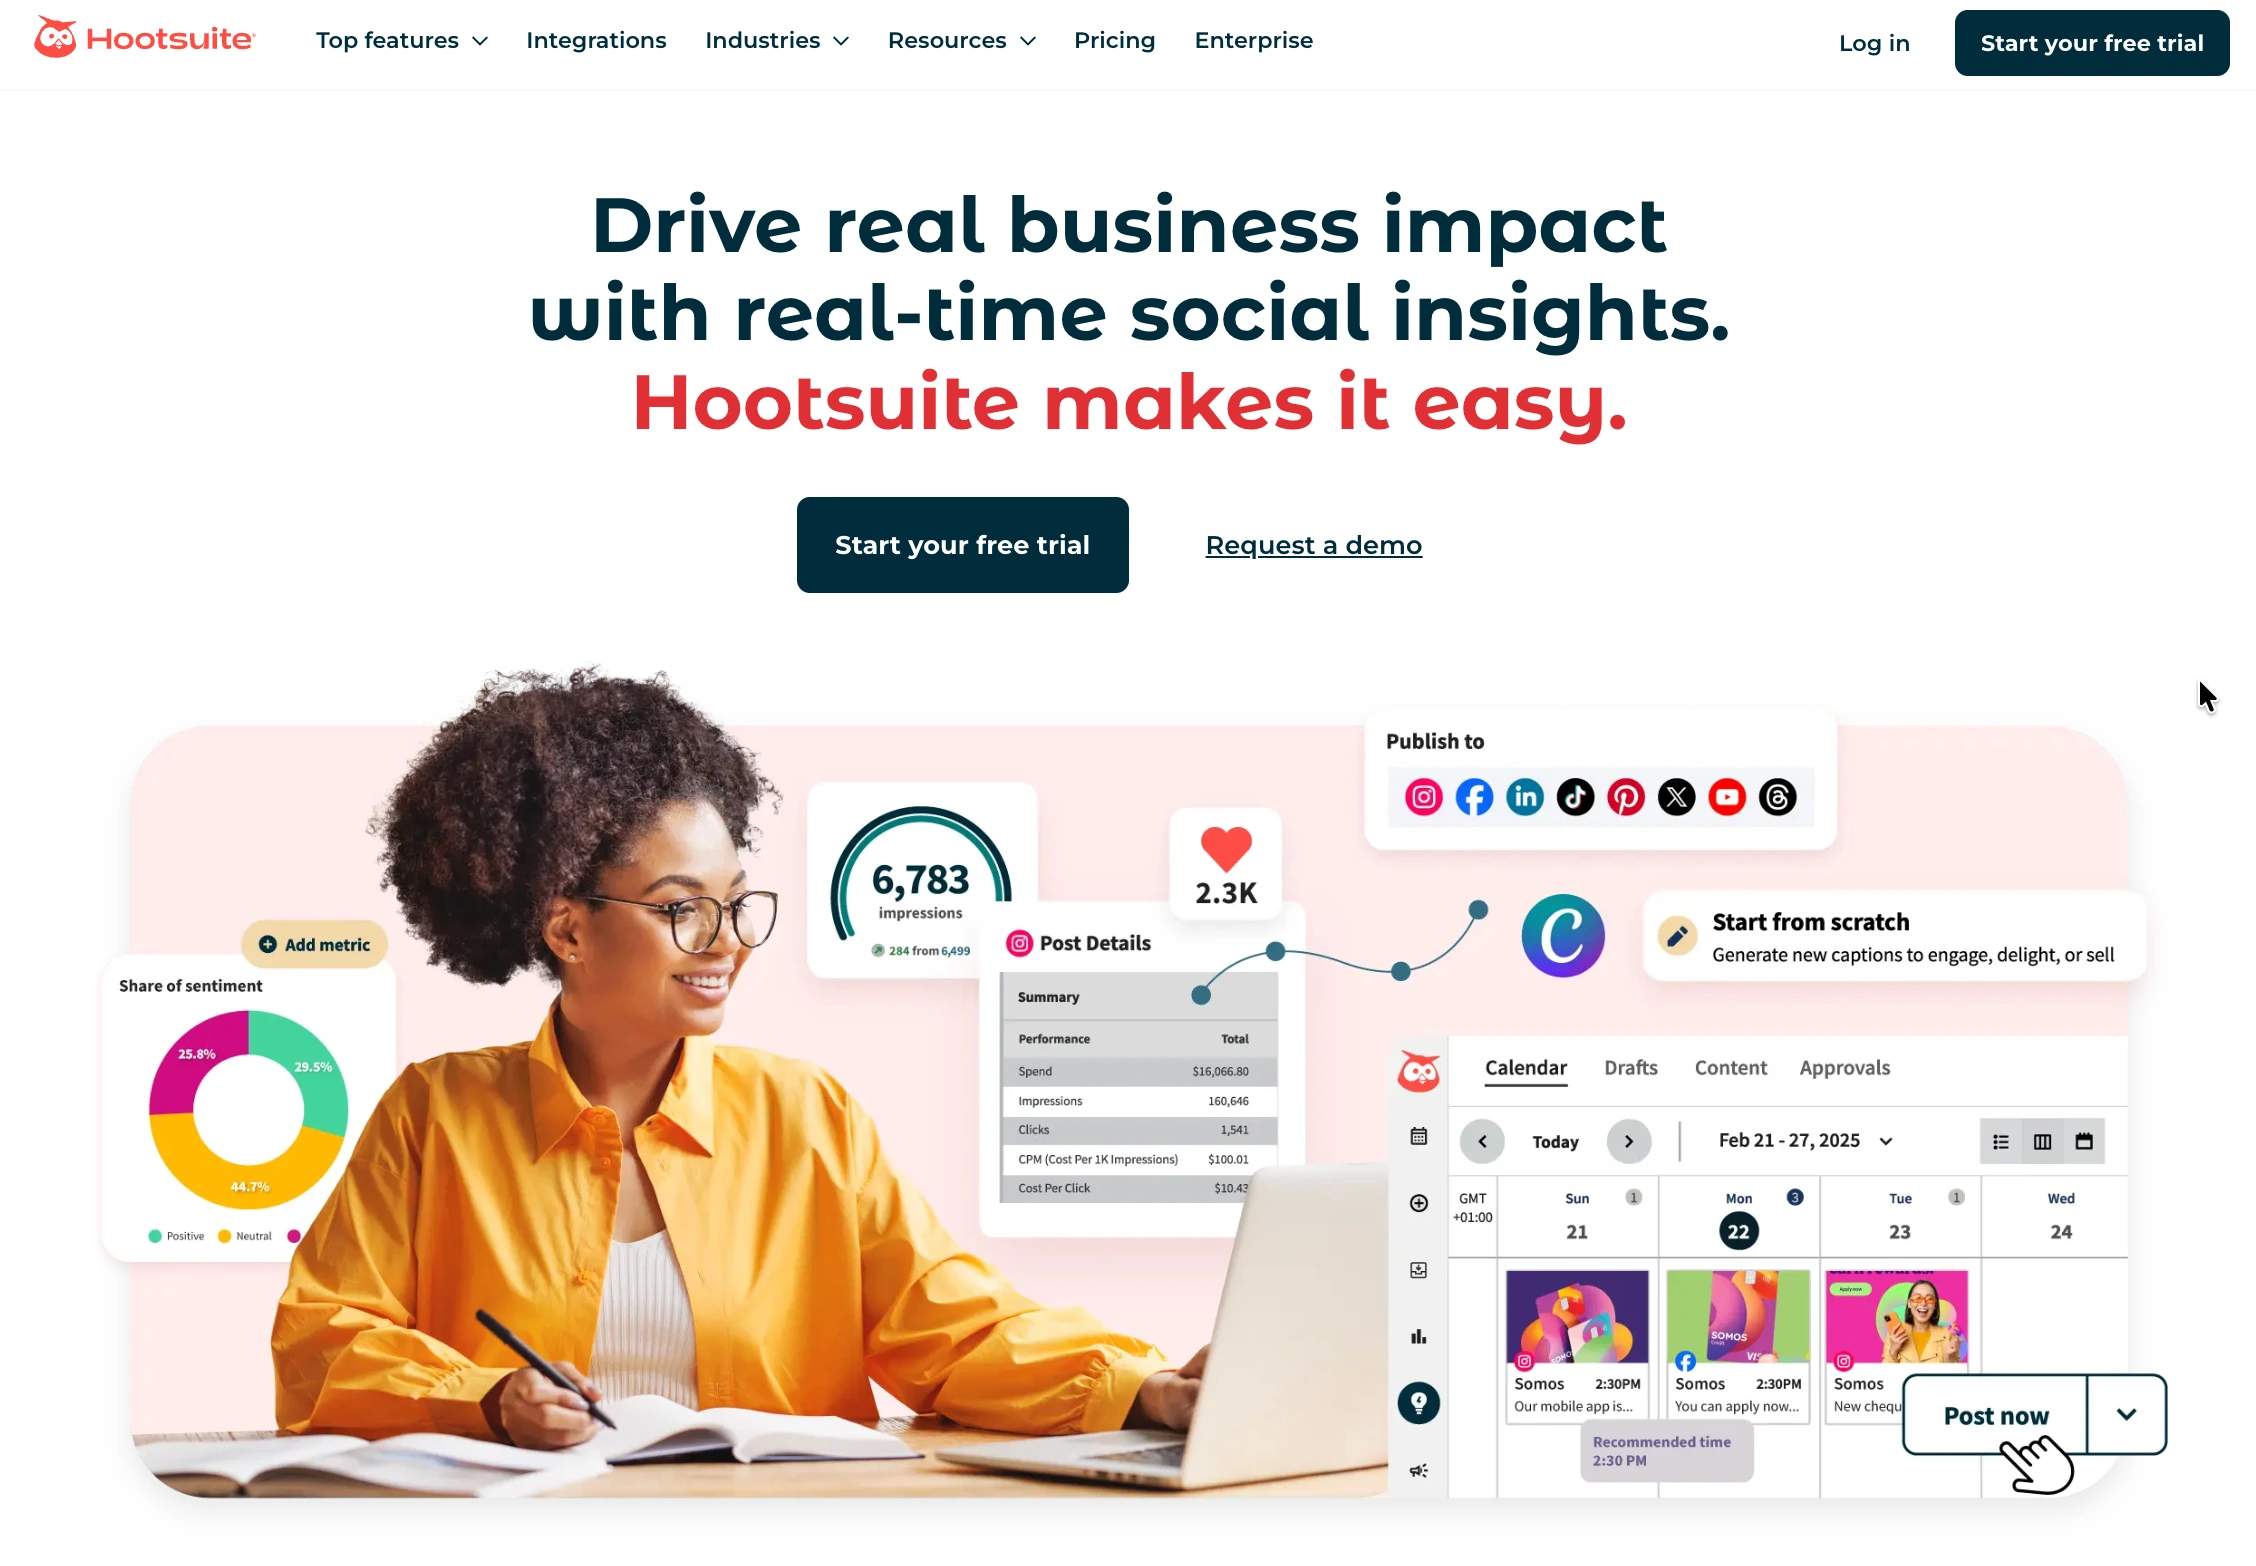
8. Hootsuite: Best Enterprise Breadth
Hootsuite rounds out the enterprise tier with TikTok analytics inside the longest-running social management platform (since 2008), plus listening, monitoring, and a custom report builder. Organizations choose it for vendor stability and breadth across many networks and teams.
At a glance: Hootsuite
- Pricing: Standard $99/user/mo (10 accounts) → Professional $199/user/mo (unlimited accounts) → Advanced $399/user/mo (unlimited accounts, approvals, bulk scheduling) → custom Enterprise
- Free option: 30-day trial
- Data history: Deep, with custom reports
- User ratings: 4.3/5 on G2 (6,615 reviews); 1.8/5 on Trustpilot
- Best for: Enterprise teams standardizing analytics across many networks
Key features:
- Comprehensive TikTok and cross-network analytics
- Social listening and brand monitoring built in
- Custom report builder
- Enterprise approvals and compliance
The honest drawback: per-user billing multiplies fast, and the analytics depth people buy Hootsuite for sits on Advanced at $399/user; the value only materializes at organizational scale.
Verdict: The pick when procurement wants one vendor for TikTok plus everything else, and the budget is already approved. Learn more in our Hootsuite pricing breakdown, Hootsuite reviews roundup, and best Hootsuite alternatives guide.
TikTok Analytics Tools Comparison Table
| Tool | Entry Price | Free Option | Data History | Competitor Tracking | Platform-Wide Research | Scheduling Included |
|---|---|---|---|---|---|---|
| PostPlanify | From $39/mo per workspace | Trial + guarantee | From connection | ❌ (benchmarks ✅) | ❌ | ✅ Full suite |
| Exolyt | $400/mo ($330 annual) | Free plan | Up to 1+ year | ✅ | ✅ (TikTok-only) | ❌ |
| Socialinsider | $82/mo | 14-day trial | 3-12 months | ✅ Core focus | ❌ | ❌ |
| Metricool | $25/mo | ✅ (1 brand) | Unlimited (paid) | ✅ | ❌ | ✅ |
| Iconosquare | $39/mo | ✅ (2 profiles) | Extensive | ✅ | ❌ | Basic |
| Later | $25/mo | Trial | Plan-dependent | ❌ | ❌ | ✅ Visual-first |
| Sprout Social | $99/seat/mo | Trial | Deep | Benchmarking | Listening add-on | ✅ |
| Hootsuite | $99/user/mo | Trial | Deep | ✅ (listening) | Listening | ✅ |
What 6,138 TikTok Videos Say About Going Viral
Everyone calls TikTok a lottery. Our data says it's closer to a grind with occasional bonuses. In PostPlanify's analysis of 6,138 TikTok videos from 76 small-to-mid-sized accounts (April to July 2026), the typical account's top-10% video earned just 2.3 times the views of its median video. We call this the 2.3× ceiling: at typical account sizes, even your hits mostly aren't moonshots. Only 1.9% of all videos beat their account's median by 5×, and fewer than 1 in 100 (0.9%) hit 10×. Meanwhile, 22.8% of videos landed below half their account's own median.
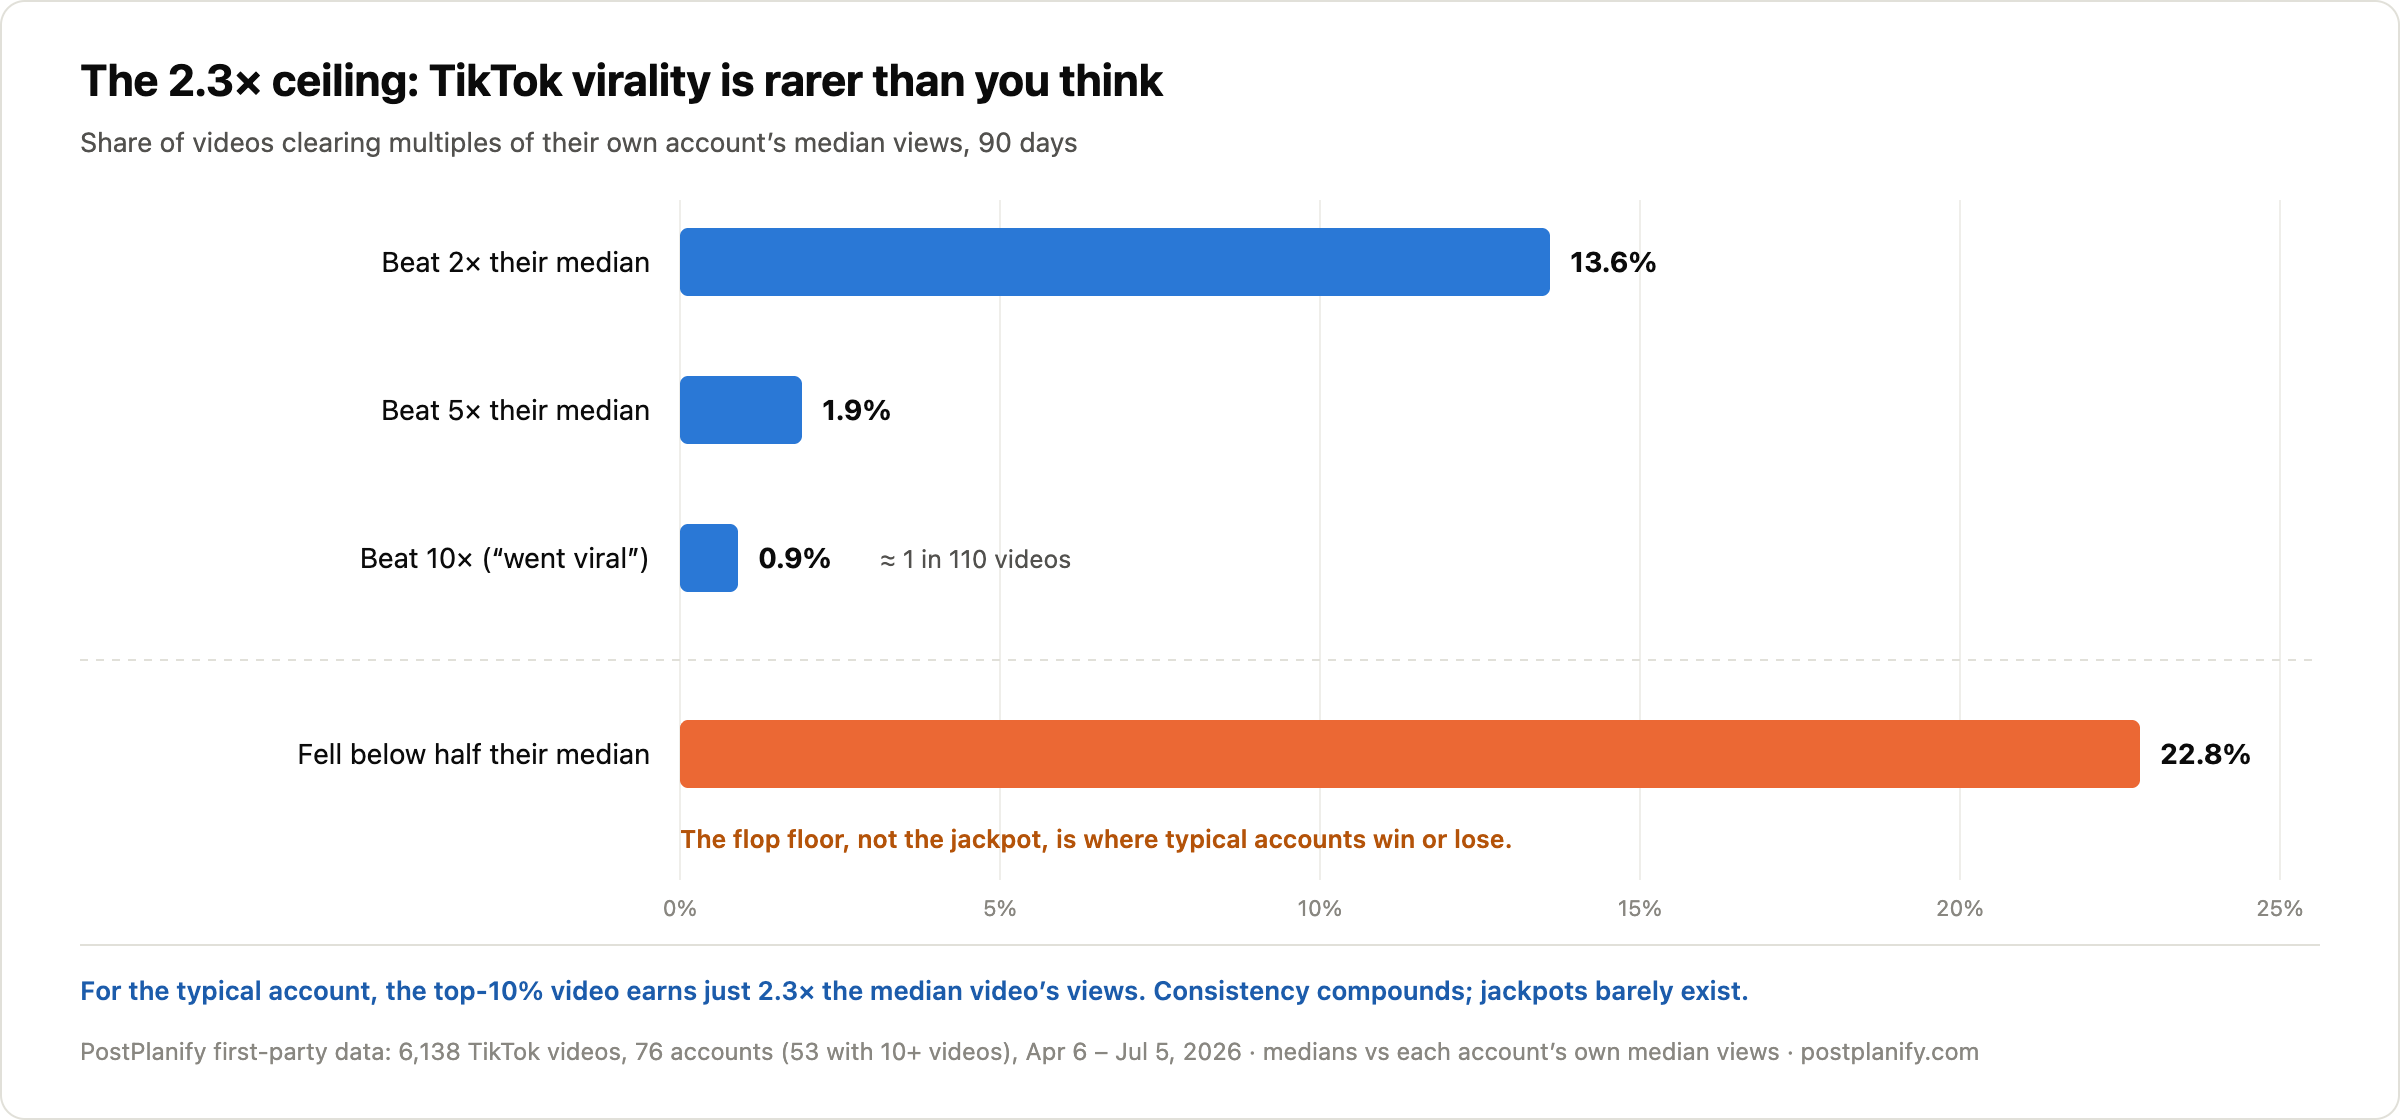
Two more numbers worth sitting with. The single best video of the quarter captured a median 9.3% of an account's total views, roughly 6 times its fair share given that the median account posted 67 videos in the window. And the median video earned 483 views, which is the number to beat before dreaming about millions.
What this means for analytics: chasing the viral outlier is a strategy you can barely even measure, because at typical account sizes it barely exists. What compounds is the floor (fewer sub-median flops) and the cadence, and you can only see either one with history, which the native dashboard deletes at day 61.
Methodology: 90-day window (April 6 to July 5, 2026), videos at least 7 days old at measurement so view counts had matured, accounts with 10+ videos in the window (53 of 76 qualified), medians throughout, view counts from TikTok's API. Correlation, not causation.
If you are weighing TikTok against other channels rather than measuring it, we compare which platforms are worth your effort in the first place from the same connected-account data.
How to Choose the Right TikTok Analytics Tool
Match the tool to the question you keep asking:
- "Are we actually growing, and can I show clients?" → PostPlanify, or Metricool on a tighter budget
- "What's happening on TikTok beyond my account?" → Exolyt for hashtags, sounds, and trends
- "How do we compare against competitors?" → Socialinsider
- "I analyze TikTok plus Instagram deeply" → Iconosquare
- "I'm a creator who wants planning plus numbers" → Later
- "The board reads my reports" → Sprout Social or Hootsuite
And whichever you pick, don't panic-read a views dip without context first. TikTok's distribution is naturally spiky, benchmarks tell you what normal looks like (our engagement rate benchmarks cover the formulas and the numbers), and if you suspect something worse than variance, our shadowban guide covers how to check. Scheduling side covered separately in our TikTok scheduling tools comparison. The full cross-platform picture lives in the social media analytics tools comparison, with sibling guides for Instagram, LinkedIn, YouTube, and Facebook.
Frequently Asked Questions
What is the best TikTok analytics tool in 2026?
For agencies serving local businesses, PostPlanify is the best TikTok analytics tool in 2026: it stores TikTok account and post analytics from the day you connect (beating TikTok's 60-day native limit), adds trends, period comparison, and benchmarking, and includes TikTok scheduling, a social inbox, and white-label reports from $39/mo per client workspace with unlimited users. For TikTok-only platform intelligence, Exolyt is the strongest specialist, and Socialinsider ($82/month) leads for competitor benchmarking.
How far back does TikTok's native analytics go?
TikTok's built-in analytics covers a maximum 60-day window for account-level data, with 7, 28, and 60-day view options. Individual video metrics remain available from each video's posting date, but account trends older than 60 days are unrecoverable in the app. Third-party tools solve this by storing your data continuously from the day you connect.
What is a good engagement rate on TikTok?
A good TikTok engagement rate depends on which formula you use. In PostPlanify's analysis of 14,000+ posts from 580 small-to-mid-sized accounts (July 2026), the median TikTok engagement rate was 1.62% per view. That's lower per view than Instagram's 3.87% because TikTok distributes content to huge non-follower audiences, inflating the view count. Measured by followers instead of views, TikTok typically leads all major platforms. Always check which formula a benchmark uses before comparing your numbers to it.
How rare is it to actually go viral on TikTok?
Rarer than TikTok folklore suggests. In PostPlanify's analysis of 6,138 TikTok videos from 76 accounts (July 2026), only 0.9% of videos earned 10 times their account's median views, and just 1.9% managed 5 times. The typical account's top-10% video did only 2.3 times its median. Meanwhile 22.8% of videos fell below half their account's median. For most accounts, growth compounds through consistency and fewer flops, not through jackpot videos.
Can I see my competitors' TikTok analytics?
Partially. Private metrics like watch time and traffic sources stay hidden, but competitor-tracking tools such as Socialinsider, Exolyt, and Metricool monitor public data: follower growth, posting frequency, content mix, and engagement calculated from public likes, comments, and shares. That's enough to benchmark your performance and spot which of their formats work.
Is there a free TikTok analytics tool?
TikTok's native analytics is free for every Business or Creator account and covers the last 60 days. Beyond that, Metricool's free plan tracks 1 brand with 30 days of history, Iconosquare's free plan covers 2 profiles, and Exolyt has a free Basic plan that tracks a single hashtag. For an instant engagement check without connecting anything, our free TikTok engagement calculator works in seconds.
Bottom line: TikTok hands you a 60-day memory, spiky distribution, and zero context, and then asks you to make content decisions. Every tool here fixes a different part of that: Exolyt reads the whole platform, Socialinsider reads your competitors, Metricool keeps cheap history, and the enterprise suites feed the board deck. PostPlanify fixes it for agencies, marketing teams, and small businesses that need their own numbers, kept forever, connected to scheduling and client reports. Try it free for 7 days, backed by a 14-day money-back guarantee.
PostPlanifyAll your social media in one simple dashboard
Schedule posts, track analytics, and reply to comments/DMs without switching tabs.
Engagement
+18%
Views
52.8k
About the Author

Hasan Cagli
Founder of PostPlanify, a content and social media scheduling platform. He focuses on building systems that help businesses, agencies, and teams plan, publish, and manage content and social media more efficiently across platforms.


